
World of the Siege FOR SALE

At fine bookshops everywhere. It’s been a long time coming, but it’s finally here. So go right out and purchase one or ten copies of the sleeper hit of the summer!
To quote from the tightly-constructed blurb:
The World of the Siege examines relations between the conduct and representations of early modern sieges. The volume offers case studies from various regions in Europe (England, France, the Low Countries, Germany, the Balkans) and throughout the world (the Chinese, Ottoman and Mughal Empires), from the 15th century into the 18th. The international contributors analyse how siege narratives were created and disseminated, and how early modern actors as well as later historians made sense of these violent events in both textual and visual artefacts. . The volume’s chronological and geographical breadth provides insight into similarities and differences of siege warfare and military culture across several cultures, countries and centuries, as well as its impact on both combatants and observers.

And, as bonus, if you act now, you can see what a semi-automated book index (with Python) looks like. What a bargain!
Cleaning Text with Python
So all us early modern Europeanists owe the Early English Books Online project a debt of gratitude. Tens of thousands of books published in England before the 19C, all of them scanned, and, in the past few years, downloadable. Thanks to the Text Creation Partnership, some 60,000 of these 125,000 books have been transcribed into full-text versions, mostly those published before 1700. Next year, 2020, everyone with an internet connection will have access to all 60,000. For now, those without an institutional subscription will have to do with only 25,000 or so. Life is hard.
No surprise, scholars have been using this resource for years, but only recently have the digital humanities matured to where we can deal with this mass of text on a larger scale, using it for more than just individual keyword searches. If you want to download what’s publicly available, you should visit the Visualizing English Print project. But as VEP explains, the hand-transcribed texts have their issues. So they’ve created ‘SimpleText’ versions of the TCP documents – no more outdated XML markup for us! And they’ve also created processed versions that have cleaned some of the most common errors in the corpus.
VEP is a great service. But I want more. So I decided to learn Python and create my own Python code (in a Jupyter notebook) to clean these EEBO TCP texts on my own terms. Some of my corrections replicate what VEP has done, but my code also goes beyond to make further changes. I’ll spare you the details here, but I go into an obscene amount of detail in the Jupyter notebook, explaining the various errors I’ve encountered, and how I went about fixing them. The code isn’t perfect, but it does a pretty good job so far, if only through repetitive brute force. And it’s really helped me learn some basic Python along the way.
Though it won’t make too much sense until you go through the notebook, here’s a summary of the variety of errors the notebook checked for in the TCP’s 1640 edition of the Duke of Rohan’s Compleat Captain (commentaries on Caesar), and how many of each it found and corrected: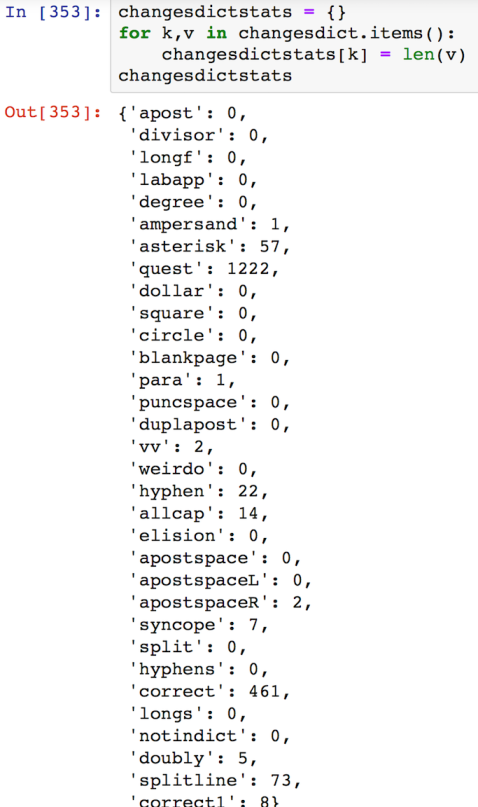
If you need a sample of the specific changes made:
And this is only the beginning.
So if you’re Python-curious and wonder what all the fuss is about, you can check out my GitHub repository: https://github.com/ostwaldj/eebo_tcp_clean_text. But be warned – for it to work, you’ll need to know a tiny bit of Python, and have Python 3+ as well as Jupyter notebooks (preferably via Anaconda) already installed. Once you have Python/Jupyter installed, you should be able to just download the repo, unzip it, open the Jupyter notebook, change the path to your machine, and it should be ready to go, at least on my sample Rohan text. For those with just a little bit of Python knowledge, it should be easy to alter the code, e.g. to expand it to cover additional types of errors or change, with just a little bit of hacking.
Hopefully, in the future, I’ll have time to set it up with MyBinder, so it can be run by anyone in a web browser.
To the future!
Sabbatical in the rear-view mirror
Now that my sabbatical has officially ended, the summer begins. I’ll gradually share with the world all the wonderful digital discoveries from my Year of the Digital. Discoveries that have so engulfed my world that I’ve slighted the blog for several months. But a short teaser list will suffice for now.
What did I do over the past year+ of “me-time”? Why, I…
- Learned enough Python to become a danger to myself, and the historical community more generally.
- Learned enough QGIS (Geographical Information Systems) to visualize the fruition of my 25-year dream to map early modern military operations.
- Reacquainted myself with some of the gritty details of MS Access and relational databases. Because somebody’s gotta make a giant dataset of all those early modern wars.
Don’t worry, there are still plenty of digital skills/tools to work on, including learning graph databases and learning enough web tools to host custom databases and maps. And let’s not forget collecting the data to put in those digital tools. Digital history is the wave of the future, after all. Today.
But first on the list is to share my first (major) Python project with the world – code that will clean EEBO TCP text documents, making them easier to analyze with natural language processing (NLP) techniques. Coming soon…
You might be Millner
If words like “Army”, “Camp”, “march”, “Day”, “pitch”, and “Leagues” outnumber many common stopwords…

You might be a campaign journal.
And if the fifth-most common word token is “d”, and if “Duke” and “Prince” are close behind, and if you capitalize your common nouns, you are pretty well assur’d that you are, in fact, an 18th century Campaign Journal.
Millner’s Compendious Journal (1733), to be precise.
For those moderns sticklers for method, lowercasing the text doesn’t invalidate the point:

Now, cleaning the dirty OCRed text? That’s another matter…
What EXACTLY Python does
Given my impassioned proselytization of digital history, it’s not surprising that I received an email from a colleague asking a reasonable, yet hard-to-answer question: “what EXACTLY does Python do?” His name’s not important, but let’s call him “Bob.”
So if you’ve bothered reading any of my recent posts, and just wish I’d start from the beginning (or shut up, already), here’s my take on Python and computer programming, geared towards computer-knowledgeable people who haven’t programmed before. This is the perspective of someone who’s been a digitally-savvy humanities-type for thirty years, but has only recently dived into learning a computer programming language from scratch. Someone, keep in mind, who’s never gotten the official version from a computer science course, but who does teach a digital history course. So it’s therefore a focus on all the small and medium-sized things you can have your computer do for individual historical research – the digital historian’s low-hanging fruit.
What EXACTLY does a computer program do?
Python is a “high-level” general-purpose programming language. Which means, it uses a syntax that is ‘relatively’ readable, unlike the machine code used by the Matrix, and it can do ALL sorts of things with just about any kind of data you can imagine. But, unlike the Matrix, you can’t really bend or break the rules. At least I can’t.

NOT Python code
So asking what ‘exactly’ a programming language like Python does doesn’t emphasize enough the fact that it does just about anything you could want, ASSUMING you have some digital information, AND assuming you want to do something with/to that data that can be translated into a series of discrete steps (an algorithm). In other words, there’s a lot of gold in them thar’ hills. But it’s only worth prospecting if you have (or can get) a lot of digital data, and need to repeat the same kinds of manipulations and analysis over and over: for each character/word/paragraph/document, I want to do X, Y, Z; if it says ‘blah’ I want to… (I just introduced you to for- and if-loops, in case you didn’t notice.) As long as the above two assumptions are met (nice to meet you, Boolean value = True), you’re golden.
Imagine that you were asked “what exactly does Microsoft Excel do?” Instrumentally, you’d probably reply that it allows you to type in numbers, edit the numbers with features like copy and paste, format the numbers in a variety of ways, perform mathematical calculations on the numbers, and print out or email the results. Or, you could answer the question by giving specific examples of projects you could do: Excel allows me to balance my budget; it lets me keep track of student grades, or my fantasy league stats. Good answers all, but just the tip of the iceberg. You could create an entire Excel spreadsheet that doesn’t have a single number in it. You could use Excel to lay out a particularly complicated table that Word’s Table feature chokes on, or that Word generally makes a pain in the arse to edit. You could, like I did twenty years ago, use Excel as a go-between when transferring Word notes into a note-taking Access database. (See! that Python post does have some utility after all.) You could even use Excel to rename a whole folder full of files based off another list, e.g. rename all those EEBO-TCP files you downloaded, which have names like A10352.txt. In a sense, that literally has almost nothing to do with spreadsheets – you delete the Excel file when you’re done, because it was just a means to an end. In other words, what “exactly” Excel does is limited most broadly by the features built into the application, but, more practically, it depends on the vision and technical expertise of the person using it.
Same with a computer programming language. But the Python canvas starts out with nothing at all on it, not even a grid of empty cells. Intimidating, but its tabula rasa lets Python deal with all sorts of different types of information, and allows you to manipulate them in an almost infinite number of ways, because you can keep building layer upon layer of functions on top of each other, drawing in data and inputs from all sorts of places, and sending them wherever you want. So, if you can think of a specific series of commands you invoke using some packaged software like Word or Excel or your web browser, you can (probably) recreate that workflow in Python. But it’s not just about replication; I see three main advantages to coding over a packaged piece of software:
- Coding allows you to totally control the inputs, the manipulations, and the outputs. Don’t like the way a program formats the results? Change it. Wish the summary feature would also include your favorite statistic? Include it. Hate how the program always does this one annoying thing? Fix it.
- Performing the task will be automated with Python, so you could run it thousands of times, in a few seconds (or more, depending on the complexity of the task), without getting carpal tunnel syndrome. Some packaged programs allow you to install or use macros to ‘record’ these repeated actions, and programming is like that, but so much more, because you have so much more control, and a much larger toolbox to draw upon. The result is a quantitative increase in speed, but that quantitative increase is really a qualitative advance – you can do things that you’d never do otherwise, because the computer does most of it for you.
- You don’t need to purchase, learn and maintain the dozen different programs that would be needed to to do (most of) the data analysis you can perform with Python. Nor do you need to worry about your specialized programs disappearing into history, as happens shockingly often unless your name is Microsoft or Apple or Adobe. Nor do you need to worry about radical changes from version to version. If you’ve experienced several generations of Microsoft Office or Blackboard or, heaven help you, mobile apps, you know what I mean. Python will definitely require you to keep an eye on changing Python library versions, and possible incompatibilities that might result. But at least with Python, you can create virtual environments so that you can run different versions of the same libraries on the same machine. And there are even web environments that allow you to set all of that up for the user.
Python, in other words, allows you to create workflows that automate a lot of the processing and analysis steps you’d have to do manually, possibly in many different programs. Input data, manipulate it in any number of ways, and then output it.
But it definitely comes with a learning curve, I won’t lie. A learning curve that is currently a lot harder for humanists, in my humble opinion, because we are not the primary users, and therefore we don’t have many pre-made, history-specific libraries with functions already designed. As a result, I’ve spent most of my time learning the fundamentals; the eye candy of maps and charts is much better served by dedicated libraries that require less programming knowledge and more domain expertise. My experience over the past several months has reinforced three important programming principles that I’m sure Programming 101 courses emphasize:
- Think through the nature of your data at each point in your code.
- Think through each logical step in your algorithm.
- Pay constant attention to the numerous syntax rules.
Ignoring any of the above will lead to runtime errors. Fortunately, you can google those error messages and probably figure out the problem, since it will likely be a violation of one of the above principles. Are you trying to use string methods on a list item? Are you expecting your iterator to be an iterable? Do you really want to put the print function inside that loop? Are you blindly copying an online example without considering how your case is different? And, as I keep telling my students, attention to details matter, whether it’s a missing close quote or a mismatched variable name. But the computer will usually tell you if you make a mistake, you learn these things over time (and build up working code that you can copy or use as functions), and practice makes perfect.
What EXACTLY does Python do for Scholars?
For scholars, a programming language like Python can help manipulate and analyze whatever text, numbers, image, video and sound information we have in digital form. Fortunately, it’s not as minimalist as all that, thanks to a few thousand free libraries (or modules) that you import into the basic Python package. The libraries do most of the hard work behind the scenes, i.e. most of the coding has already been done by the libraries’ authors, so you just plug and play with some standard commands, your specific data, the specific variables you create, and the specific commands combined in the specific order you choose. Figure out how to get your information into the code (i.e. the computer’s) memory in a specific format based on its structure (is it a string? a list? a dictionary?…), manipulate the resulting data (maybe you convert the string to a list, after replacing certain features and adding others), pass it on to the next block of code that does something else (now that it’s a list, you can loop through each item and count those that start with the letter ‘q’), do more things to the list and the count (maybe if the count exceeds a certain threshold, you send that word to another list), then pass any of those results on to the next block of code, until you end up with what you want. To give a simple real-world example: maybe you’ve started with a long string of text (like this paragraph here), you tokenize it into a list of individual words (deciding how you want to deal with punctuation and contractions), then count the words according to the letter they start with, then plot a histogram showing the frequency of each letter.
Python is also attractive to scholars because it’s free – insert joke about poor professor here. Its costlessness and open source ethos have encouraged hundreds of people to create free general libraries focusing on particular types of data and particular types of analysis, along with specialized domain libraries for astronomers, for geographers, for audiologists, for linguists, for stock market analysts… There is also a massive number of tutorials available online. Every year there are a dozen Py conferences held all over the world, and several hundred of the presentations are available on YouTube, including numerous 3-hour tutorials for beginners. You can also check out the Programming Historian website, which has numerous examples in Python. There are numerous cautions with programming (in our case, use Python 3+, not 2.7…), but there are lots of resources that discuss those. Plenty of ways to get started, in other words.
A final benefit of particular importance for humanities-types is Python’s ability to convert words into numbers, usually behind the scenes, and highlight patterns using various statistical properties of text. Such powerful text functions allow businesses to data mine tweets and online content; business demand seems to have juiced computer science research, leading to lots of advanced natural language processing (NLP) features, on top of those driven by the (older) linguistic and literary interests of academics. So, if you have a lot of digitized text or images and you want to clean/analyze them beyond just reading each document one by one, or manually cycling through search results, one… hit… at… a… time…, then Python is worth a look.
What EXACTLY does Python do for this Historian?
So here’s a list of the python projects I’ve been working on, and those I will be working on in the future. A few are completed, a few have draft code, a few have some ideas sketched out with snippets of code, and a couple are still in the fantasy phase. Many use the standard functions of off-the-shelf libraries, while others require a bit more custom coding. But they all should be viable projects – time will tell.
- Semi-automate a book index: Find all (okay, maybe most) of the proper nouns in a PDF document, along with which PDF page each occurred on, then combine them together into a back-of-the-book index format. If you don’t want to pay $1000 to have your book professionally indexed, you could use Word’s or Adobe’s indexing feature, which requires you to go through every sentence and identify which terms will need to be indexed. Or, you can get 85% of that with Python’s NLP (natural language processing) libraries, or you can import in a list of people/places/events and it will find those for you. As with all programs, things will get complicated the more edge and corner cases you try to address: Do I need to include a “he” on the next page with the full name on the previous page? Do I just combine together all consecutive pages into 34-39, or do I need to judge the importance of the headword to each page’s discussion? Tough questions, but this code will, at the least, give you a basis from which to tweak. And, judging from recent indexes in books published by highly-reputable academic presses, nobody cares about the ‘art’ of indexing anymore: some are literally headwords with a giant undifferentiated list of several dozen page numbers separated only by commas; some don’t even provide any kinds of topics, only proper nouns. Of course, the index may well die as more works are consumed digitally…
- Web scraping: Automate downloading content from a website, either the text on pages, entries in a list, images of battle paintings from Wikipedia, or linked files… Maybe automate the SPARQL query on historical battles I posted about awhile back. Or download a bunch of letters from a site that puts each letter on its own separate page. Maybe automate scraping publication abstracts from a website based off records in Zotero. (with a library like beautifulsoup)
- Web form entry: I’d like to create code that would automate copying bib info from Zotero (author, title, date, pages, etc.) and then paste it into our library’s online ILL form in the respective webform fields, which, of course, aren’t in the same order as the Zotero field order. That means a bunch of cutting and pasting for every request.
- Look up associated information on an entity (person, place, organization) with Linked Open Data, e.g. find the date of birth for person X mentioned in your text document via the web. (rdflib)
- [Added by request – get it?] APIs: Numerous institutional websites allow you to access their online data more directly through API, rather than using brute force scraping to harvest information from their pages’ HTML. Those websites have APIs (Application Program Interfaces) to allow more sophisticated downloading of information. You can search their site for ‘API’ to see if they offer it. (requests)
- Convert information into data: My two previous posts on AHA department enrollments and parsing long notes illustrate how this can be done with Python. Code that converts information into data is particularly important low-hanging fruit for historians, since we lack a lot of already-digitized datasets – this kind of code allows us to create them with our own data.
- Clean dirty OCR text: Correct OCR errors, and generally make a document more readable by humans and computers. A good, detailed description is Ryan Cordell’s Q i-jtb the Raven: Taking Dirty OCR Seriously. This requires a lot of hands-on work with the code, which I’ve been doing of late. E.g. find every occurrence of ‘Out-work’ and convert it to ‘outwork’ – so we can count them all the same way. Find every misOCRed ‘Mariborough’ and convert it to ‘Marlborough’ – there are big lists of common errors available to make this search-and-edit process a bit more precise. But since you’ll never guess every word that might be hyphenated due to line endings, finding every hyphenated word (like ‘be- siege’) and converting it back (to ‘besiege’) is easy enough, with regular expressions. You can even create a list of all the changes your code makes (i.e. create a dictionary with each ‘mistake’ and what it was changed to), if you want to audit the process. More difficult are the Questions of Capitalizations (case), especially when our 17-18C Authors liked to capitalize lots of Nouns, yet modern NLP uses Capitalization as one of its Clues for identifying Proper Nouns (Named Entity Recognition). Ideally you’d have this code as a series of functions so that you can run the various corrections across an entire folder of documents, based on what that source needs. Then, you could use more code to check for any other errors or documents that require special handling.
I’d argue that this is currently the most critical area for digital history, the bottleneck, in fact. So few historians have their own sources in clean full text, yet it’s also a very idiosyncratic thing to program, based on historically-variant word usage and widely-varying source genre vocabulary, as well as the sometimes-random errors derived from OCRing irregularly set type from a few hundred years ago. (It’d be great if OCR accuracy rates were 100%, but that ideal would seem to require having high-quality scans of the originals, which your average scholar does not have, and will likely never acquire, because we don’t actually own the originals). As a result, cleaning historical OCRed text is the area with the least amount of pre-made code available – big projects like EEBO and ECCO paid cheap foreign labor to type theirs by hand. We should also note that lots of social scientists, for example, talk about ‘preprocessing’ text, but by that they mean standardizing the spelling of text that’s been born digital, making everything lowercase, stripping out punctuation, etc. Historians need a lot of pre-preprocessing first because we are dealing with imperfectly OCRed text. And if we want to retain a cleaned text copy of the original, and not just atomize the text string into a list of word tokens, then it’s even more complicated. Suggestions welcome! Ted Underwood has provided some useful ideas in various venues dealing with big data (10,000s of texts), but his cleaning code on GitHub is a bit above my skill level. - Quantitative analysis: Load your spreadsheet into the pandas library and run stats, plot charts… (pandas, matplotlib, seaborn, bokeh for interactivity)
- Make interactive visualizations, create interactive websites with your data, and so on. (bokeh…)
- Create a visual timeline, drawn from data extracted from a document. Possibly interactive. Haven’t explored this yet, but I will.
- Mapping: Quickly make maps, including small multiples, in whatever projection, with whichever features you want to display. Look up coordinates (aka geocode) and calculate spatial/topological relationships… It’s good to see that there are several international project teams working on historical gazetteers, and a number of groups have georeferenced some early modern maps as well. (geopandas, cartopy…)
- Network analysis: create a network ‘graph’ (diagram) of entities and relationships between those entities (nodes and edges), and measure the topological properties of the network, who are the hubs, the spokes, the nodes… (networkx)
- Relational database interactions with SQLite and MySQL. (sqlite3) I believe you can do the same with graph databases (triplets of subject-verb-object), but I haven’t really looked at those.
- Zotero: Update and manipulate your Zotero records. I can already read Zotero data into Python and hand it off to other libraries for analysis, as well as go in the other direction, e.g. mass update fields back in Zotero. But I’d like to create code that will take a PDF page (or two) of a book’s table of contents and enter a separate record for each chapter in the book into Zotero, automatically adding in all the other book info. (pyzotero)
- Dates: Automatically calculate duration between two dates, convert between OS and NS and other historical calendars, look up “last Tuesday’s” date when mentioned in a letter written on July 7, 1700 – you could probably automatically insert that date into the source document if desired. Maybe even do a quick calculation to see how few days you have left on your sabbatical… (calendar, datetime, dateutil, convertdate, dateparser, arrow)
- Textual analysis: This is a biggie for historians. Create a corpus of texts in your area; create a list of people, places and events to use for extraction; cluster works (or segments) together by the topic they discuss; see how often different authors/texts use particular words/phrases; identify which words tend to be collocated with which other words; keywords-in-context; sentiment analysis; etc. Did I mention fuzzy searching, finding words that are spelled similarly? Or finding words that are used in the same context as a given word? Maybe you want to analyze your own prose: which words/phrasings/grammatical structures do you overuse? (NLTK, spaCy, textacy, gensim, word embeddings…)
- Bibliometrics and Historiographical Analysis: From a secondary source, extract all the people, publications, places and time periods/dates mentioned, and graph/map them, before comparing them with other authors. Or analyze the sources cited in the bibliography – authors and affiliations, years of publication, languages, etc. The sciences have a lot of this already because they mostly publish journals and they’re in databases like Web of Science. This also ties into network analysis, especially if you want to look at citation networks.
- Analyze words/phrases from the 16m-book HathiTrust collection. There’s a website for that, but you can also download the data, or subsets at least.
- Genealogy: parse genealogical data and analyze. Would be interesting for royal lineages, and some work has already been done on that.
- Sound analysis. Haven’t played with these, but some people are into reconstructing soundscapes and the like.
- Image classification and analysis: Group together all the portraits of person X, etc. Haven’t played with these, though you have similar classification algorithms in Facebook, etc.
- Lots of full-fledged programs are also python scriptable. E.g. both ArcGIS and QGIS have python interfaces, which means you can automate many of the boring tasks you need to perform when making more sophisticated maps.
- Clean up your computer files – batch rename, copy, delete, convert, etc., with much more flexibility than Mac OS X’s Rename function.
- Automate lots of administrative school work. Create a syllabus class schedule that lists the day of week and date for each meeting during the semester, removing any holidays or other days off for that specific semester. I’ll be department chair next year, and there are lots of stats and reports on enrollment, assessment… that I’d like to automate: collecting the data from databases/surveys and then analyze them, without me having to manually repeat the entire process every time. A computer science colleague will have a student working on a course scheduler next semester – given a department’s faculty requests, the available timeslots, and a few dozen university and departmental scheduling requirements, come up with a schedule that meets all those criteria, or at least the most important ones. Now, we have to do this by hand (with Excel, but still), and it’s a real pain.
- Machine learning/AI: Python is also one of the main languages used for this new burgeoning field. For historians, that might mean classifying documents and topics, but I haven’t looked into it enough to think about how it could be used. Some of the above-mentioned libraries might well be superseded by machine learning libraries in the future, where things like neural nets figure out their own algorithms without rules being specified by the programmer. I think we’re already seeing a little bit of that with NLP.
And those are just a few of the things you can do with Python! So whatever data-related project you can think of, there’s probably a way to do it in Python. It’s not just automating the things that you find yourself doing on the computer over and over and over and over again. Just as important, what are the research questions that you want to ask, especially those that would require a lot of drudgery like counting and sorting and revising thousands of documents? Any software package that will answer that particular question for you will have its own learning curve, and there probably aren’t many people whom you could hire to do it for you, so you will probably be on your own. Whatever your question, there’s likely a way to combine the various Python tools together in a way that gets you the desired output.
But that’s not all. Using code also means:
- You can take whatever output and turn it into the input for another bit of code, and so on and so on. It is practically infinitely extensible.
- You can rerun your code but change a parameter, to see the difference it makes. ‘What-if’ exploration is super simple, and you can easily change a parameter anywhere in the workflow and continue the rest of your code with the new results.
- When you’re all done with your code, you can run it on another data set or text, or a whole folder full. And then you can compare the results.
- When you notice an intriguing pattern in one of your sources, you can quickly add another bit of code to explore it. Then you can look for that pattern in your other documents.
- You will also have a record of your process and method: which data you used for which analysis, how you cleaned the data, which settings and parameters you used, the order in which you performed your various steps, and so on. I’m guessing that more than a few historians would be unable to repeat, much less explain, how exactly they got the results they did. How faithfully, for example, do we record our computer-based research workflow? Some grant agencies are beginning to require recipients submit their data and workflow, along with their results. “Replicability” could even come to mean something in History.
This historian’s “killer app” for Python is a program that reads in a (primary or secondary) source from a text file, and then the code provides statistics on the words and phrases used, identifies rare terms that are unusually common in that document (compared to some corpus), extracts all the proper nouns mentioned, provides a statistical overview of their frequency (overall, and by section of book…), looks up information on the people (say, their nationality, age, etc.), then looks up the coordinates of mentioned places and maps them according to some criteria (by person who mentions the place, by where in the text it is mentioned, by what other things are mentioned around that place…). One output of all this could be tables or graphs of the entities in the text, word visualizations and the like. Another output could be automatically-created maps – not just maps of any of the above entities, but small-multiple maps that would locate a variable (say, siege duration) across four different theaters, and then another set of small-multiple maps that would similarly map the same variable by year instead. Might as well have it make a heat map while you’re at it. Several groups have already created web versions of some of these features (voyant-tools among them). But with your own code, you also end up with all these results in the code itself, which can be further analyzed with yet more code. Then, your code runs itself on a bunch of other documents, and includes comparisons between documents – which texts talk more about place X? This works for teaching as well as research. Imagine if you had a class where you assigned a source, had the students analyze it, and then put an interactive visualization of the document up on the screen to explore. This really wouldn’t be that hard – I already have almost all of the bits, and it’s just a question of chaining them all together. It will take a while to make sure the objects, logic and syntax are all copacetic, but hopefully it’ll be done in time for classes next fall.
If you’re not sure about diving into Python, I’d suggest you start by getting as many of your sources in digital form as possible. Scan, OCR, type. Then get yourself a decent text editor like Notepad++ or Text Wrangler/BBEdit and start learning regular expressions.
But the more historians we get writing Python code, the more history-specific code we can build off of. So let’s get started.
From historical source to historical data
Where I offer a taste of just one of the low-hanging fruits acquired over my past five months of Python: The Sabbatical.
Digital history is slowly catching on, but, thus far, my impression is that it’s still limited to those with deep pockets – big, multi-year research projects with a web gateway and lots of institutional support, including access to computer scientist collaborators. Since I’m not in that kind of position, I’ve set my sights a bit lower, focusing on the low-hanging fruit that’s available to historians just starting out with python.
Yet much of this sweet, juicy, low-hanging fruit is, tantalizingly, still just out of reach. Undoubtedly you already know that one of the big impediments to digital history generally, and to historians playing with the Python programming language specifically, is the lack of historical sources in a structured digital format. We’ve got thousands of image PDFs, even OCRed ones, but it’s hard to extract meaningful information from them in any structured way. And if you want to clean that dirty OCR, or analyze the text in any kind of systematic way, you need it digitized, but in a structured format.
My most recent python project has been to create some python code that automates a task I’m sure many historians could use: parsing a big long document of textual notes/documents into a bunch of small ones. It took one work day to create it, without the assistance of my programming wife, so I know I’m making progress! Eventually I’ll clean the code up and put it on my GitHub account for all to use. But for now I’ll just explain the process and show the preliminary results. (For examples of how others have done this with Python, check out The Programming Historian, particularly this one.)
Parsing the Unparseable: Converting a semi-structured document into files
If you’re like me, you have lots of historical documents – most numerous are the thousands of letters, diary and journal entries from dozens of different authors. Each collection of documents is likely drawn from a specific publication or archival collection, which means they begin being all isolated in their little silos. If you’re lucky, they’re already in some type of text format – MS Word or Excel, a text file, what have you. And that’s great if you want just to search for text strings, or maybe even use regular expressions. But if you want more, if, say, you want to compare person A’s letters with person B’s letters over the same timespan, or compare what they said about topic X, or what they said on date Z, then you need to figure out a way to make them more easily compared, to quickly and easily find those few needles in the haystack.
The time-tested strategy for historians has been to physically split up all your documents into discrete components and keyword and organize those individual letters (or diary entries, or…). In the old days – which are still quite new for some historians – you’d use notecards. I’ve already documented my own research journey away from Word documents to digital tools (see Devonthink tag). I even created/modified a few Applescripts to automate this very problem in Devonthink in a rudimentary way: one, for example, can ‘explode’ (i.e. parse) a document by creating a new document for every paragraph in the starting document. Nice, but it can be better. Python to the rescue.
The problem: lots of text files of notes and transcriptions of letters, but not very granular, and therefore not easily compared, requiring lots of wading through dross, with the likelihood of getting distracted. This is particularly a problem is you’re searching for common terms or phrases that appear in lots of different letters. Wouldn’t it be nice if you could filter your search by date, or some other piece of metadata?
The solution: use Python code to parse the documents (say, individual letters, or entries for a specific day) into separate files, making it easy to hone in on the precise subject or period you’re searching for, as well as precise tagging and keywording.
Step 1:
For proof of concept, I started with a transcription of a campaign journal kindly provided me by Lawrence Smith, in a Word document. I’m sure you have dozens of similar files. He was faithful in his transcription, even to the extent of mimicking the layout of the information on the page with the use of tabs, spaces and returns. 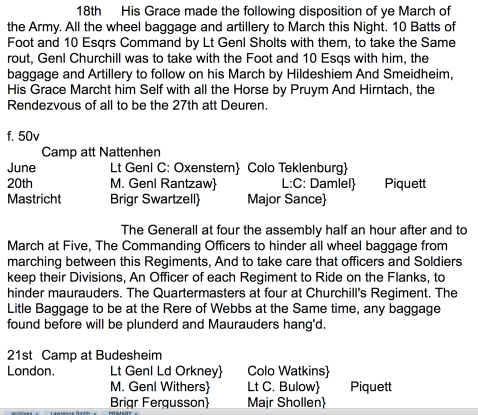 Great for format fidelity, but not great for easily extracting important information, particularly if you want, for example, June to be right next to 20th, instead of on the line below, separated by a bunch of officers’ names. (‘Maastricht’ and ‘London’ are actually a bit confusing, because I’m pretty sure the place names after the dates are that day’s passwords, at least that’s what I’ve seen in other campaign journals. That some of the entries explicitly list a camp location reinforces my speculation.) Of course people can argue about which information is ‘important,’ which is yet another reason why it’s best if you can do this yourself.
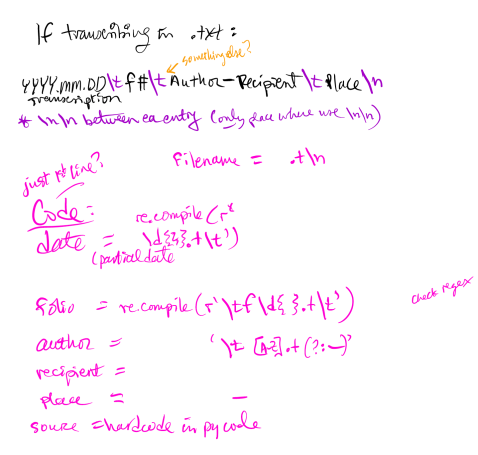
Aside: As you are examining the layout of the document to be parsed, you should also have one eye towards the future. In this case, that means swearing to yourself that: “I will never again take unstructured notes that will require lots of regex for parsing.” In other words, if you want to make your own notes usable by the computer and don’t already have a sophisticated database set up for data entry, use a consistent format scheme (across sources) that is easy to parse automatically. For example, judicious use of tabs and unique formatting:
Step 2:
Clean up the text, specifically: make the structure more standardized so different bits of info can be easily identified and extracted. For this document, that means making sure each first line only consists of the date and camp location (when available), that each entry is separated by two carriage returns, and adding a distinctive delimiter (in this case, two colons, ‘::’) between each folio – because you’ll ultimately have the top level of your structured data organized by folio, with entries multiple entries per folio (this is a one-to-many relationship, for those of you familiar with relational databases like Access). Cleaning the text can be easily done with regex, allowing you to cycle through and make the appropriate changes in minutes. Assuming you know your regular expressions, that is.
The result looks like this:
Note that this stage is not changing the content, i.e. it’s not ‘preprocessing’ the text, doing things like standardizing spelling, or expanding contractions, or what have you. Nor did I bother getting rid of extra spaces, etc. Those can be stripped with python as needed.
For this specific document, note as well that some of the formatting for the officers of the day is muddled (the use of curly brackets seems odd), which might equal loss of information. But if that info’s important, you should take care to figure out how to robustly record it at the transcription stage. If you’re relying on the kindness of others, ‘beggars can’t be choosers.’ But, if you’re lucky, you happen to have a scanned reproduction of a partial copy of this journal from another source, which tells you what information might be missing from the transcription:
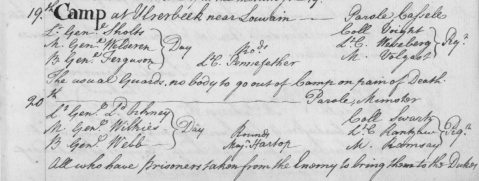
Camp journal sample of above, from British Library, Add MS 61404, f. 45.
You probably could do this standardizing within your Python code in Jupyter Notebook, but I find it easier to interact with regex in my text editor (BBEdit). Your mileage may vary.
Step 3:
Once you get the text in a standard format like the above, you read it into python and convert it into a structured data set. If you don’t know Python at all, the following details won’t make sense. So go read up on some Python! One of the big hurdles for the neophyte programmer, as I’ve discovered over and over, is to see how the different pieces fit together into a whole, so that’s what I’ll focus on here. In a nutshell, the code does the following, after you’ve cleaned up the structure of the original document in your text editor:
- Read the file into memory as one big, long string.
- Perform any other cleaning of the content you want.
- Then you perform several passes to massage the string into a dictionary with a nested list for the values. There may be a better, more efficient way to do this in fewer lines, but my beginner code does it in three main steps:
- Convert the document to a list, splitting each item at the ‘f. ‘ delimiter. Now you have a list with each folio as a separate item.
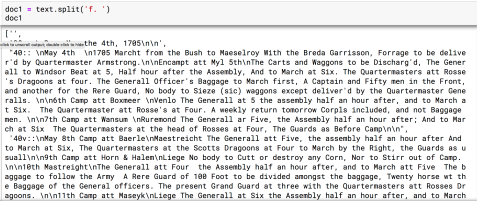
- Always look at your results. For some reason, the first item of the resulting list is empty (it doesn’t seem to be an encoding error), so just delete that item from the list before moving on.
- Now, read the resulting list items into a python dictionary, with the dictionary key the folio number, and all of the entries on the folio as the value of that folio. Use the ‘::’ as the delimiter here, with the following line of code, a ‘comprehension’, as they call it. Notice how the strip and split methods are chained together, performing multiple changes on the item object in that single bit of code:
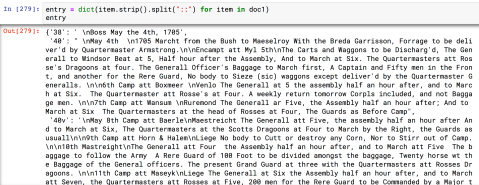
- Now you use a for loop to parse each value into separate list items, using the other delimiter of ‘\n\n’ (two returns) between entries, using the string of the value (since otherwise it’s a list item and the strip and split methods only work on strings). This gives you a dictionary with the folio as the dict key, and the value is now a nested list with each of the entries associated with its folio as a separate item, as you can see with folio 40’s four entries:

- Convert the document to a list, splitting each item at the ‘f. ‘ delimiter. Now you have a list with each folio as a separate item.
That’s pretty much it. Now you have a structure for your text. Congratulations, your text has become data, or data-ish at least. The resulting python dictionary allows you to search any folio and it will return a list of all the letters/entries on that folio. You can loop through all those entries and perform some function on/with them. So that’s a good thing to “pickle”, i.e. write it to a binary file, so that it can be easily read back as a python dictionary later on.
Once you have your data structured, and maybe add some more metadata to it, you can do all sorts of analysis with all of Python’s statistical, NLP, and visualization modules.
But if you are still straddling the Devonthink-Python divide, like I am, then you’ll also want to make these parsed bits available in Devonthink. Add a bit of code to write out each dictionary key-value pair to a separate file, and you end up with several hundreds of files:
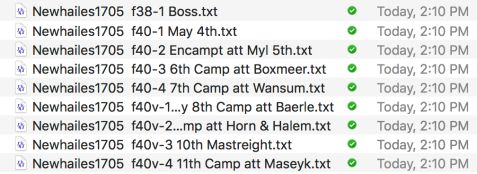
Each file will have only the content for that specific entry, making it easy to precisely target your search and keywording. The last thing you want to do is cycle through several dozen hits in a long document for that one hit you’re actually looking for.
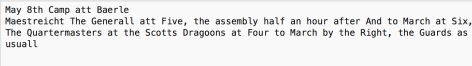
That’s it. Entry of May 8th, 1705 in its own file.
The beauty is that you can add more to the code – try extracting the dates and camps, change what information you want to include in the filename, etc. Depending on the structure of the data you’re using, you might need to nest dictionaries or lists several layers deep, as discussed in my AHA example. But that’s the basics. Pretty easy, once you figure it out, that is.
Even better: now you can run the same code, with a few minor tweaks, on all of those other collections of letters and campaign journals that you have, allowing you to combine Newhailes’ entries with Deane’s and Millner’s and Marlborough’s letters and… The world’s your oyster. But, like any oyster, it takes a little work opening that sucker. Not that I like oysters.
Where the historians are, 2017
“Shaving the yak” is a phrase used to describe the process of programming. It alludes to the fact that you often have to take two, or more, steps backward in order to eventually move one step forward. You want a sweater, so first you need to get some yarn, but to do that you have to… and eventually you find yourself shaving a yak. The reason why you even consider shaving a yak is that, once you’ve shaved said yak, you now have lots of yarn, which allows you to make many sweaters. This colorful analogy has a surprising number of online images, and even an O’Reilly book. It’s a thing.
I have been doing a lot of digital yak-shaving over the past four months. Come to think of it, most of my blog posts consist of yak shaving.
So if you’re interested in learning to code with Python but not sure whether it’s worth it, or if you just want to read an overview of how I used Python and QGIS to create a map like this from a big Word document, then continue reading.
Have I mentioned the Future is Digital?
At least until the lights (or internet) goes down.
I’m preparing my appeal to you faithful skulkers to assist me in my quixotic quest to create a more robust and usable dataset on early modern European wars. I envision keeping it simple, at least at the start, posting a series of spreadsheets (possibly on Google Sheets) with information about various aspects of early modern warfare. We don’t want to start from scratch, so I’ve downloaded the basic information on the period’s wars and combats (“battles”) from Wikipedia, via Wikidata queries using SPARQL. And I’ve been learning about graph databases in the process, which someone might consider a bonus.
Wikipedia??? Well, the way I see it, they’ve already entered in a lot of basic information, and many of the factual details are probably correct, at least to a first order approximation. So it should speed up the process and allow us to refine and play around with the beta data (say that fast three times) before it’s “complete,” however that’s defined.
Once the data sheets are up online, we can clean that information, I can collate it, and then we can open it to the world to play with – analyze, map, chart, combine with other data, whatever one’s heart desires. If someone wants to deal with the Wikipedia bureaucracy, they can try to inject it back into The Source of All Knowledge.
In the meantime, if you’re curious as to what someone with some programming skills and an efficiency-oriented mindset can create, you should check out the following blog post, wherein a data scientist collects all of the wars listed in Wikipedia (Ancient to recent), and then explores their durations and a few other attributes. Very cool stuff, and you gotta love the graphics. Check it out at https://www.gokhan.io/post/scraping-wikipedia/. And just imagine what one could do with more granular data, and possibly more accurate data as well! Hopefully we’ll find out.
In the meantime, here’s a real simple map from a SPARQL query locating all of the “battles” listed in Wikidata (that have location information).
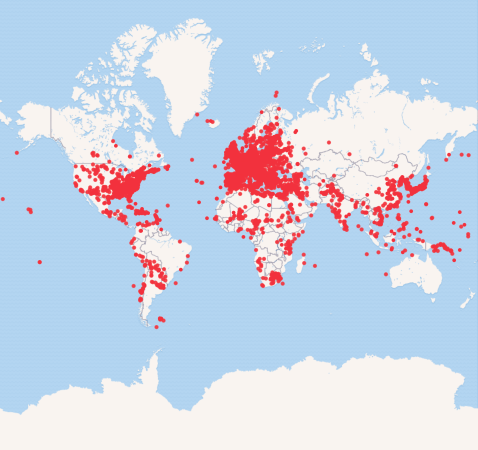
I’ll let you decide whether Europe and the eastern US really were that much more belligerent than the rest of the world. To the Methodology!
Early Modern Spain on a Budget, part 2
When we last left off, we’d just come back from medieval Tolédo, full of New Castilian culture.
From Conquerors to Conquered
Having spent a week spying vestiges of conquistadors in our historical visits around Castile, we spent the second week of our trip looking at the other side of the hill. And a few fortresses.
So it was on to Barcelona. We survived an Ugly American (Brooklynite, actually) incident on the train, but when we arrived in Spain’s northern capital, it almost seemed like there was some sort of disagreement between the two parts of the country. My first clue was the “War of the Flags,” where people proudly hung their Catalan flags from their apartment balconies, far outnumbering the Spanish flags.

Fortunately there wasn’t any rioting after Real Madrid spanked Liverpool in the Champions League final.
My first impression of the city? Central Barcelona is a much more modern city than central Madrid, but with just as many tourists. The bread, I should note, is infinitely better than what we had in Madrid – must be the proximity to France, where they know how to bake bread. Bâtards.
Anyway, Barcelona has its own attractions. We spent the mandatory tourist dollars visiting Gaudí’s Sagrada Familia cathedral – mostly standing on narrow tower steps waiting for the line of people to keep moving down, not wanting to contemplate a fall.

This photo gives me vertigo…
And then we experienced the virtual-reality smartphone-headphone set up of Casa Bottló. I guess I was just fated to be an early modernist.
Historiographical imperialism?
Speaking of early moderns, I was struck by the predominance of Anglo authors in the early modern Spanish history section of the Spanish bookstores – names you know, like Geoffrey Parker and John Lynch and J.H. Elliot, not to mention authors like John Keegan, and lots of Spanish translations of English-language histories. I’m guessing Franco’s heavy hand might have had something to do with the seeming silence of senior (native) Spanish historians, but that’s just speculation on my part.
History as Catalan Nationalism
Later on, we spent a half-day at the waterfront, and semi-randomly selected the Museum of Catalonian History as our destination. The museum covers the history of the Catalan region(s) from prehistory to today. When you hear somebody say “from prehistory to the present,” you undoubtedly think “so, like a few mannequin cavemen and they jump forward to the 19th century, right?” Well, let me tell you, I never saw so many rooms on medieval history in my life. More Catalan kingdoms and principalities than you could shake that proverbial stick at (again with the sticks? what’s up with those sticks?).
One fun fact of medieval nationalism I came away with: the origin legend for the Catalan flag (the Senyera above) is that, during the 897 siege of Barcelona, a grateful king dipped his four fingers in a mortally-wounded Catalan count’s blood and dragged it across the count’s golden shield, thanking him for his service. If I were the count, I probably would’ve requested some pain killers as a reward instead, but I guess they did things differently back then. Apparently the Austrians have a similar tale for their own crimson-streaked flag dating from the 13C. But for those who prefer stories of the pen to those of the sword, the museum also had a 10 minute video on making parchment, quill and ink from scratch. “Shaving the yak” indeed.
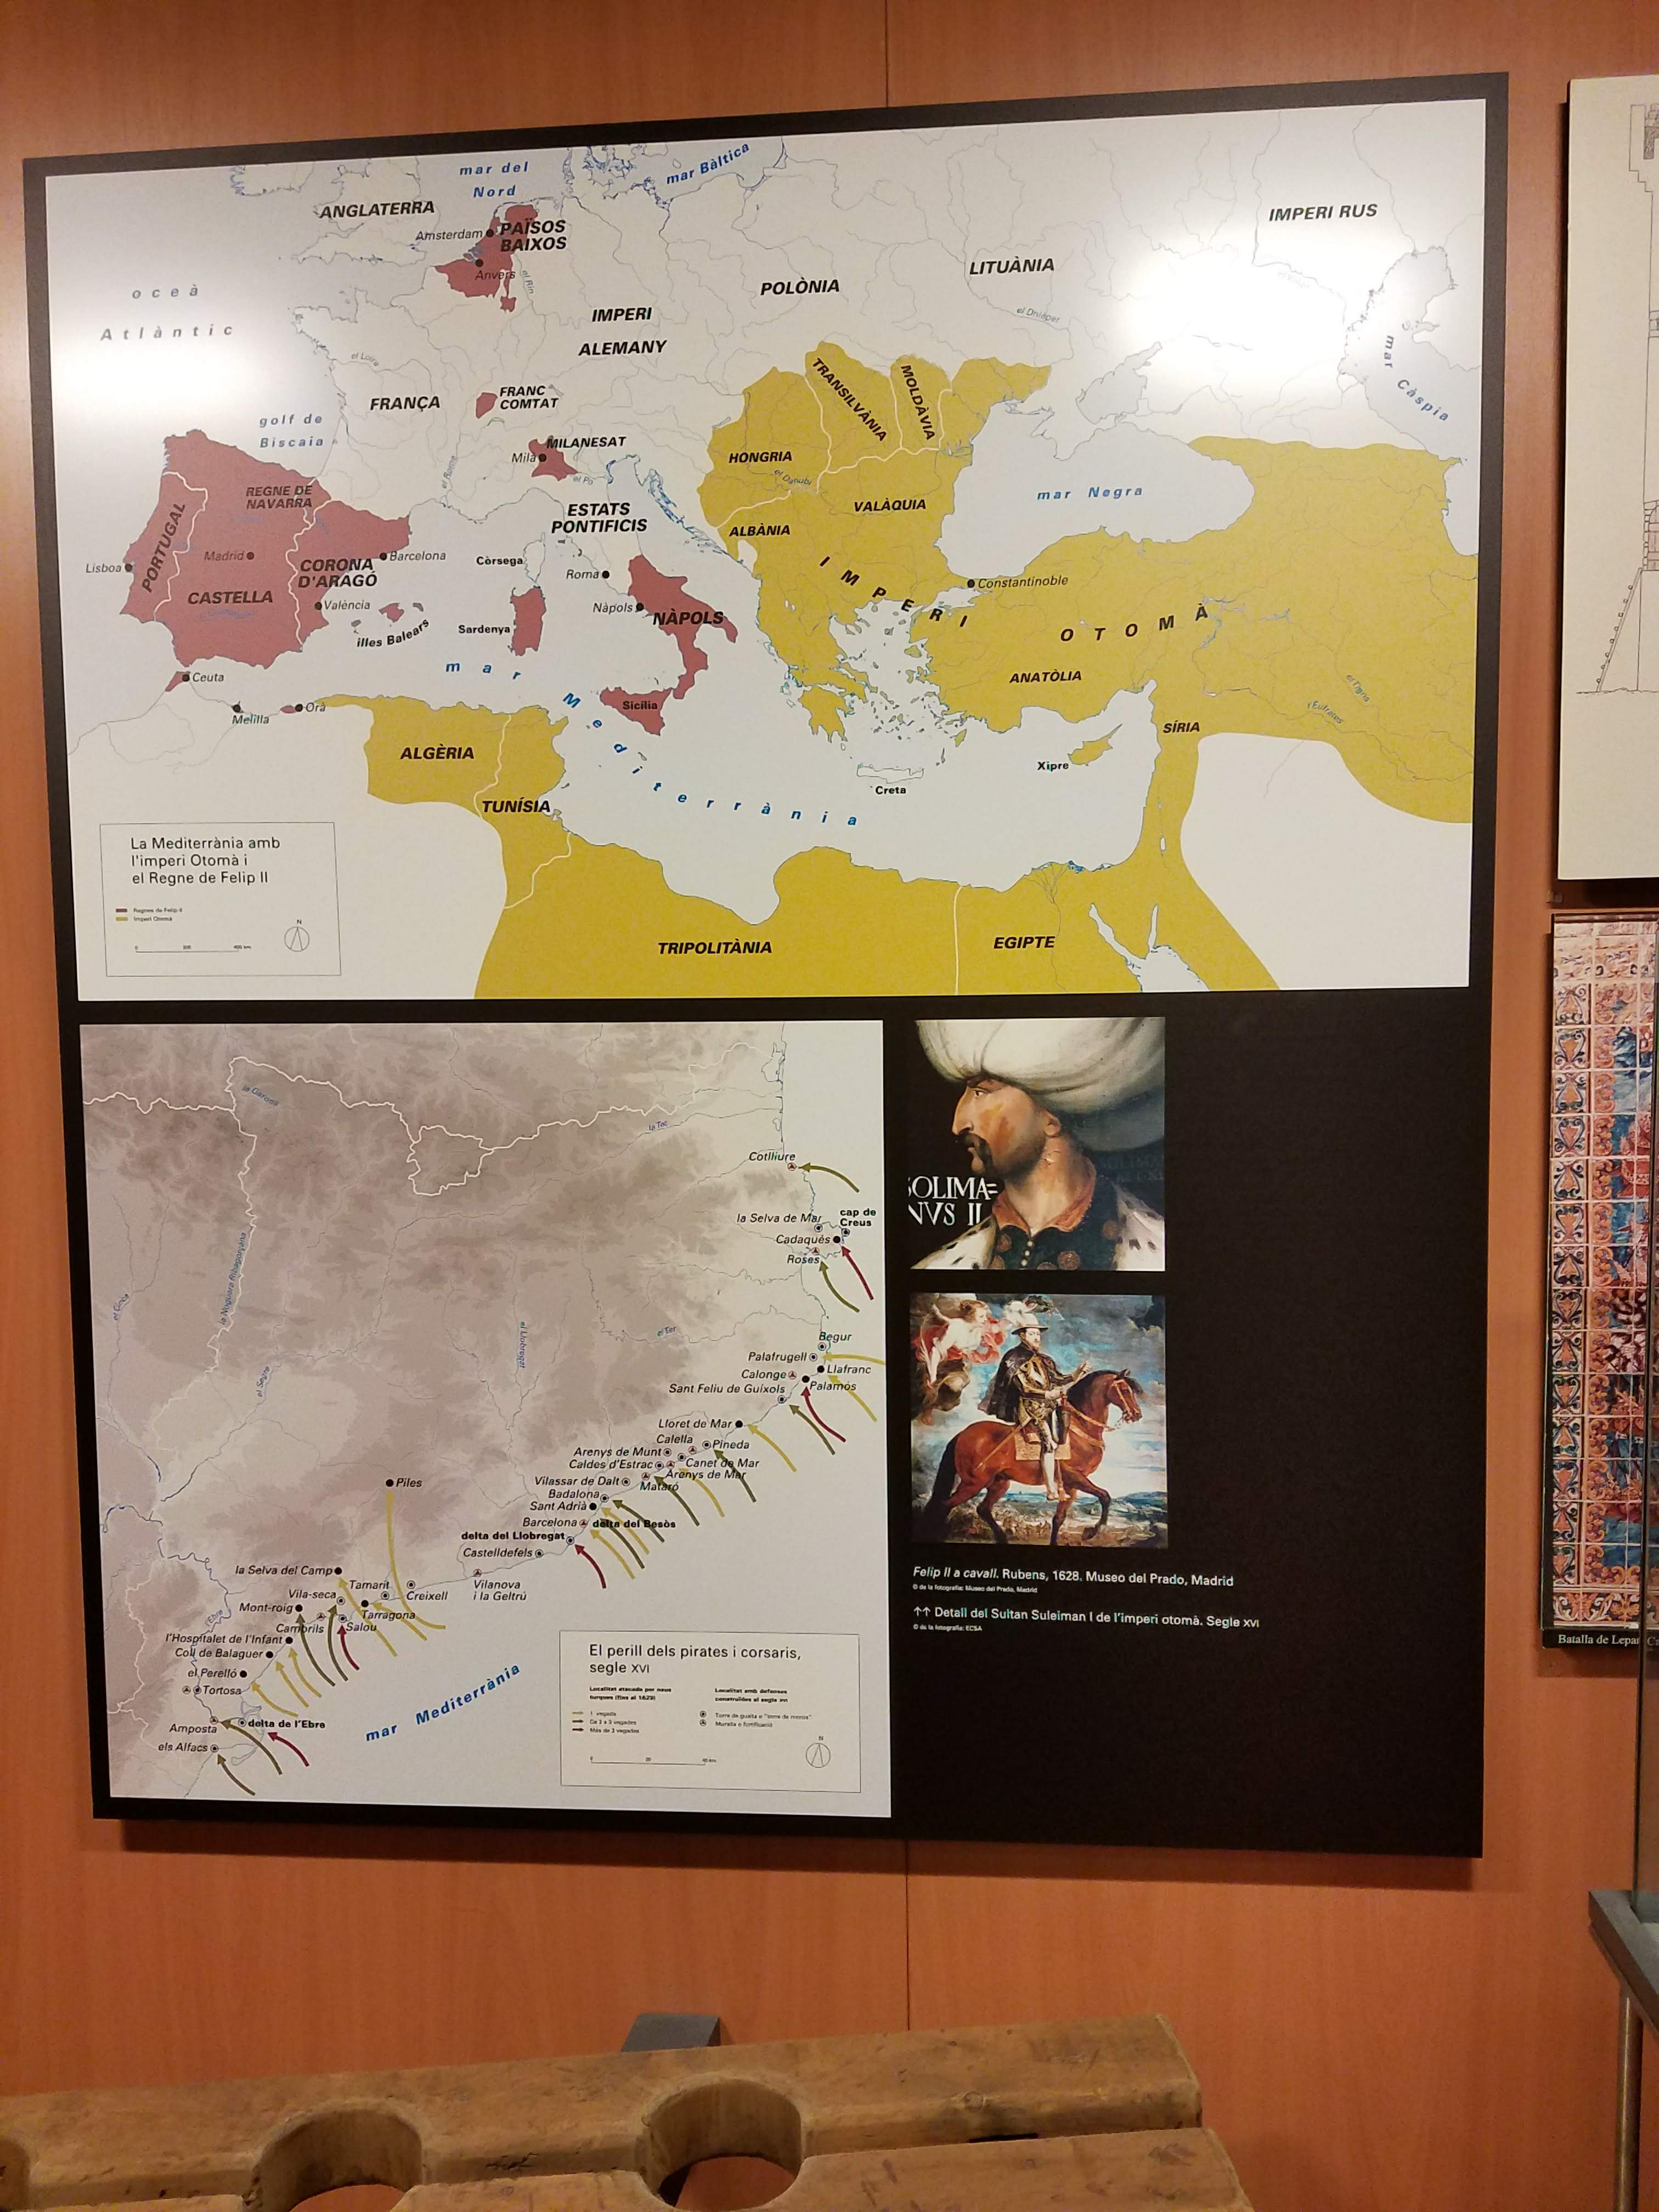
The Trouble with Pirates
There was even a model of the fortress of Salses, a Pyrenean fort that we had visited several years earlier during our southern France excursion. What a small world.
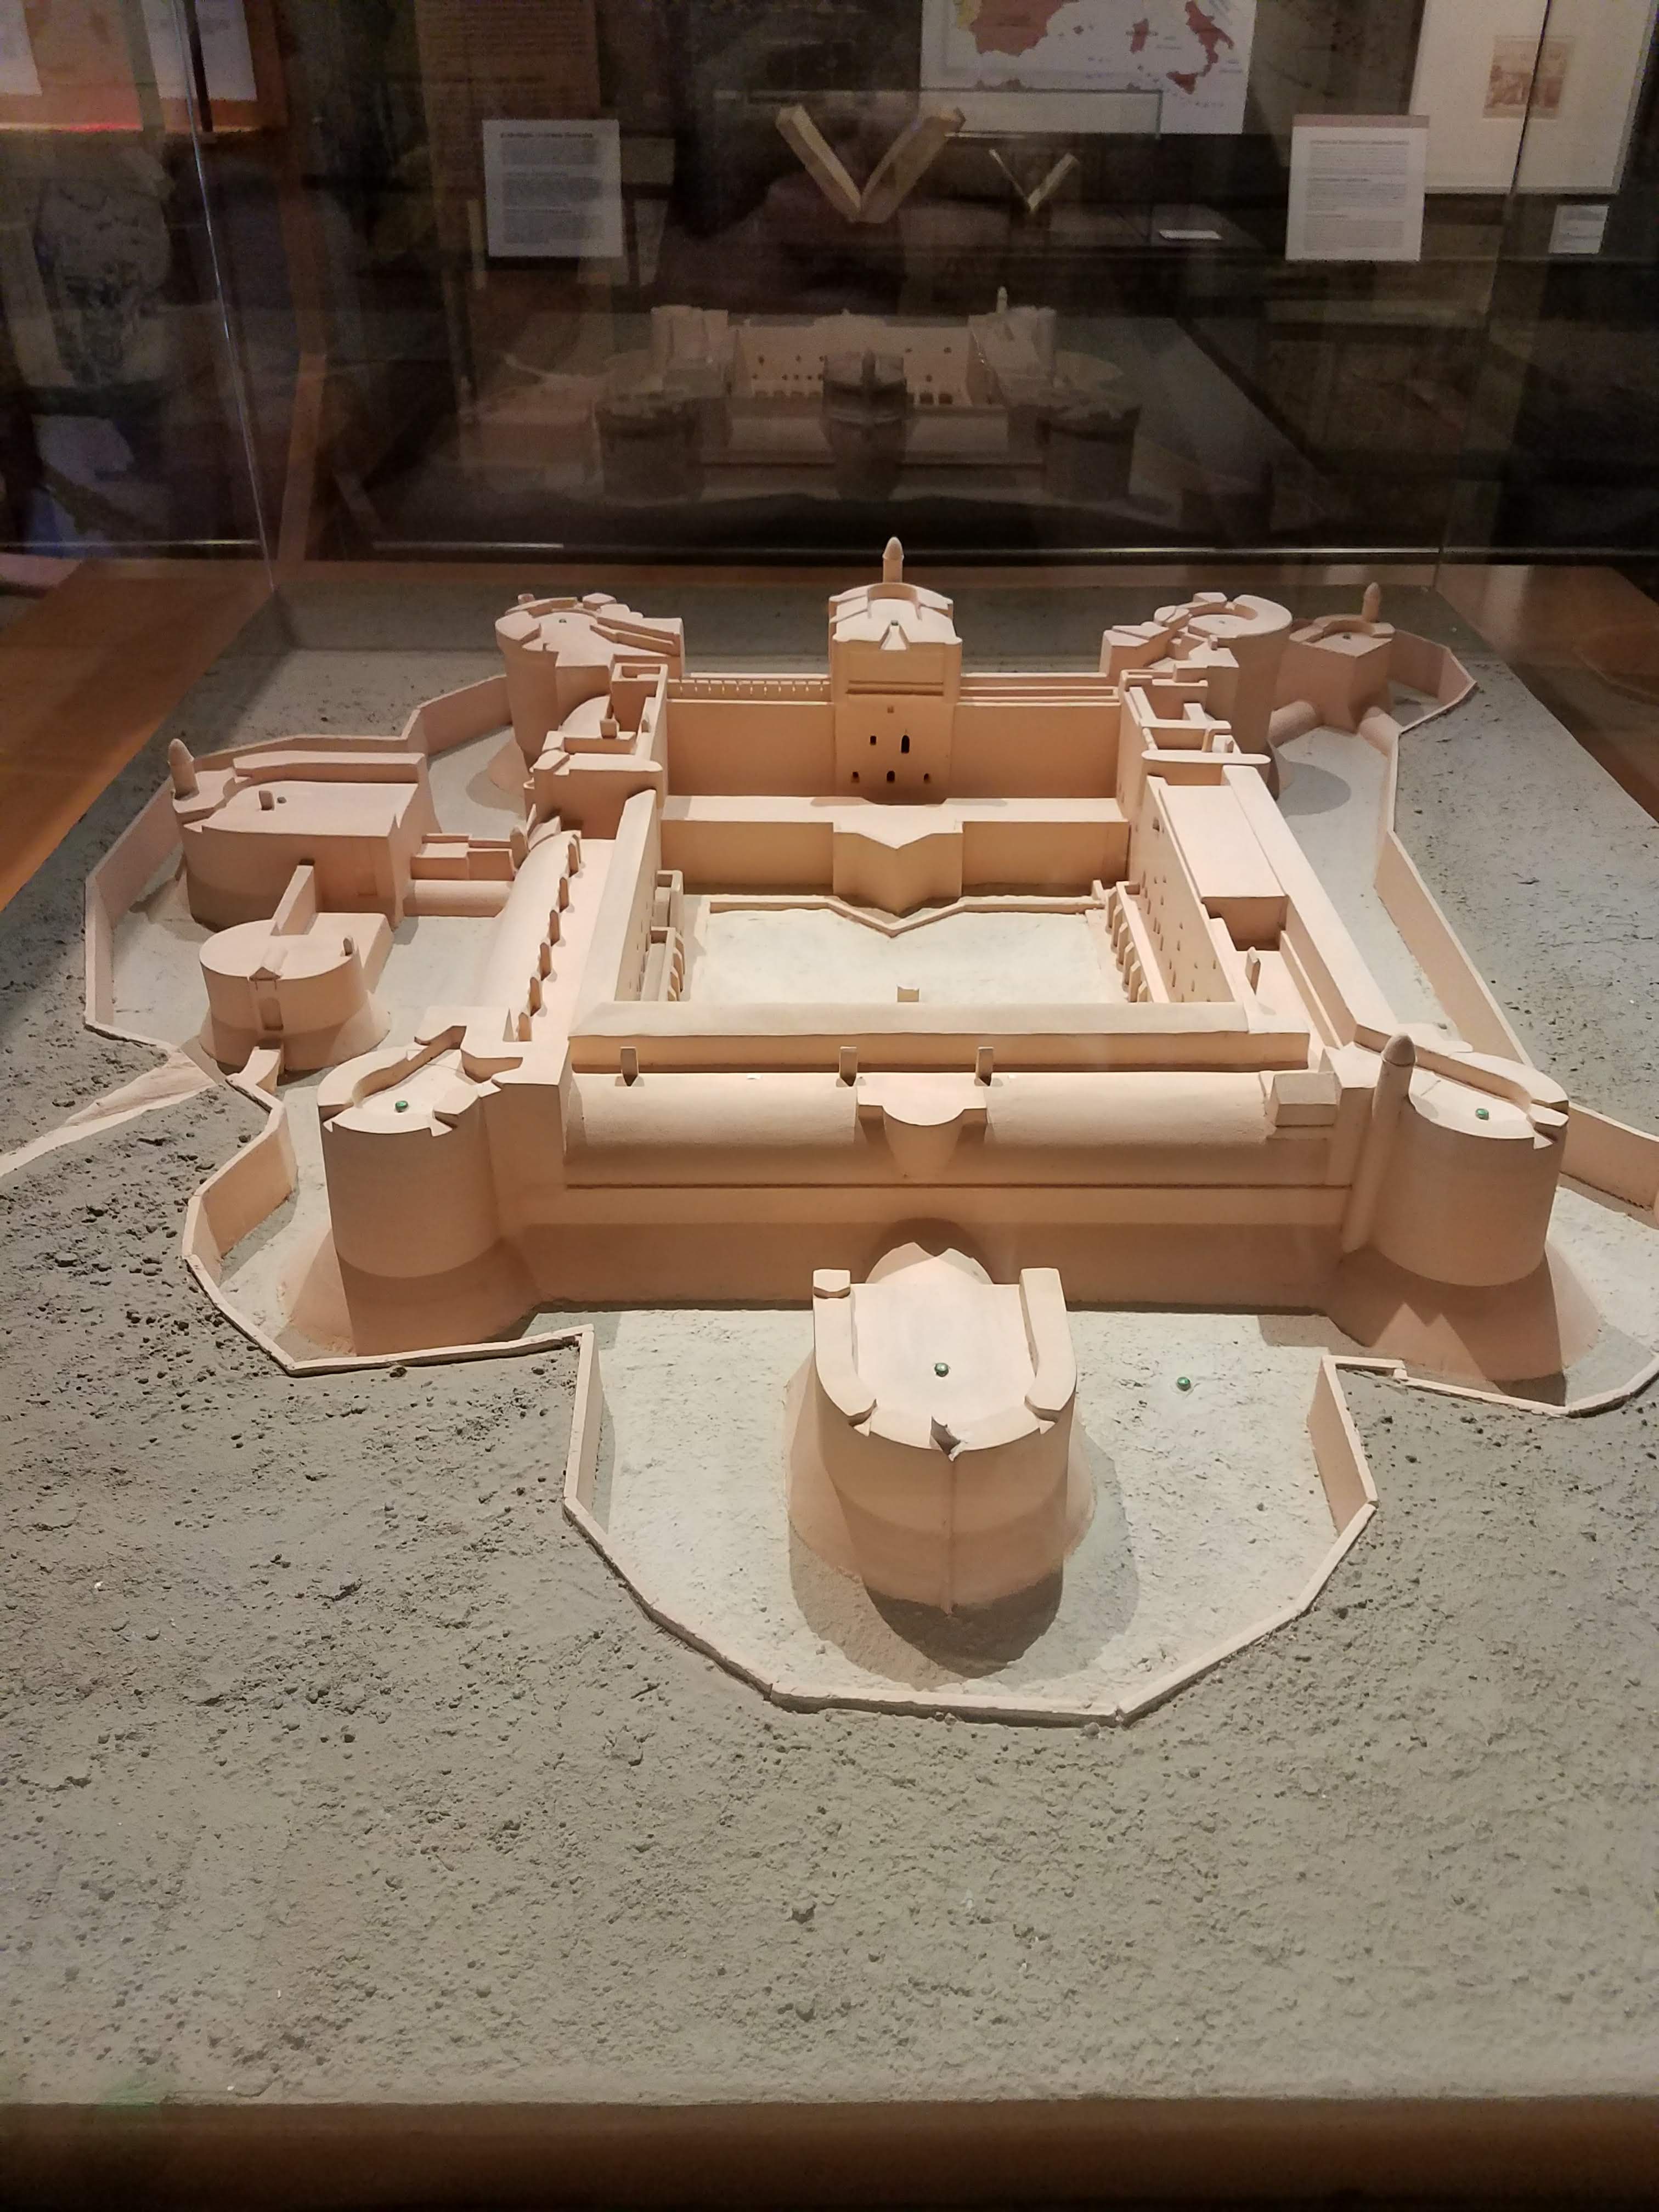
The Salses gateway (on the left, in the model above) from our visit to the real thing:

Fortress of Salses, Languedoc
There was also an interesting display on the 1640 ‘Reaper’ revolt, where the irregular miquelets rose up against Castilian taxes and governance during Olivares’ Franco-Spanish War (part of the Thirty Years War, for those of you keeping track at home). One of the songs from the conflict, “The Reapers” (Els Segadors), is currently the Catalan ‘national’ anthem.
Unlike Tolédo’s Museo del Ejército, the Museu d’Història de Catalunya clearly considered its history very important, and its experience in the War of the Spanish Succession as particularly relevant to today. They have a whole online exhibition on the war, if you’re interested.
For those who aren’t already familiar with the two-minute narrative: over the course of the war, Philippe’s forces managed to repulse two separate Allied occupations of Madrid, and went on to recapture most of its territory after the battlefield victory at Almansa. Obligingly, the British facilitated this reconquest by choosing to abandon their Austrian and Catalan allies after getting most of their Spanish contingent captured at Brihuega.
Animated map of Allied holdings in Iberia, War of the Spanish Succession
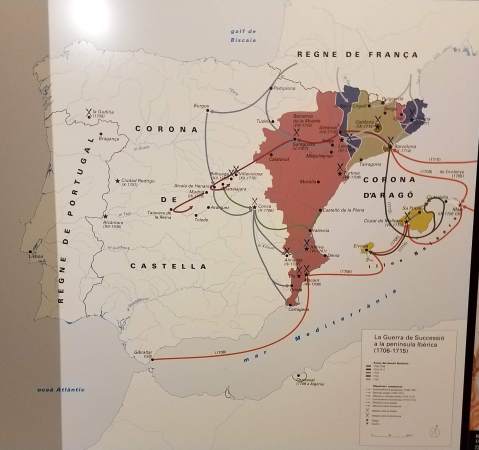
A much better map of the Iberian War of the Spanish Succession. I’d thought there was a western front on the Portuguese border, but what do I know?
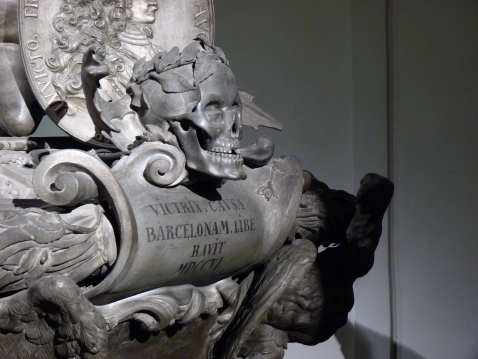
And, in case the Catalan bent of the museum had eluded you up to that point, the museum had a rather large exhibit on the Catalan catastrophe that was the fall of Barcelona in 1714. The War of the Spanish Succession had largely ended in 1713. But those crazy Catalans kept on fighting long after their Austrian candidate ‘King Carlos III’ abandoned them for the Imperial throne in 1711 – becoming Holy Roman Emperor Karl VI. It appears that Karl’s former Spanish digs would remain on his mind, since he refused to acknowledge Felipe as King of Spain for decades. And clearly the memory of Barcelona in particular stayed with him, at least in death, as my wife and I witnessed when viewing his crypt at the Kapuzinergruft in Vienna a few years earlier. Here’s a close-up of his tomb, which celebrates his 1706 liberation of the city:
But I digress. Since Barcelona wouldn’t surrender after fighting had ended everywhere else, that meant that the Duke of Berwick – you know, the English one in French service loaned out to the Spanish – had to besiege the fortress, exposing the city to a third siege in a decade, fourth, if you include a brief, unsuccessful Allied attack in 1705.
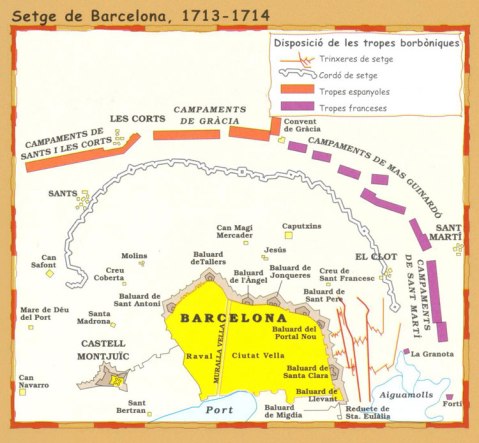
At siege’s end, after a year-long defense, a peeved Philippe ordered his commander to slaughter the population for their rebellion. Instead Berwick decided to give them a capitulation on the 11th of September. Catalan privileges were revoked, and it was all downhill from there.
Commemorating the People’s Resistance to an Oppressive Southern Neighbor
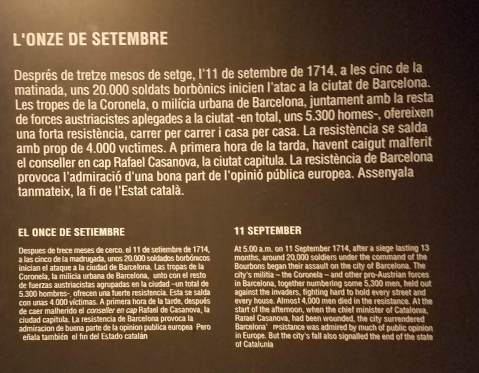
The explanation, in three languages
So I guess the Catalonians had their 9/11 long before the U.S. had ours. And the rest, as they say, is history.
Overall the museum was very well done, lots of interesting maps and more descriptive text than you can imagine. Somebody spent a lot of time on this museum. And it’s been noticed, witness this hot-off-the-press study I just saw:
Abstract:
Another day, another fortress.
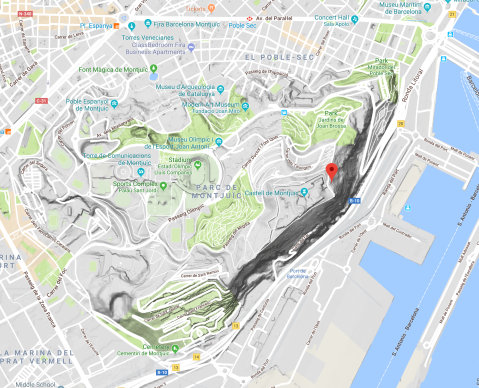
In case you had any more interest in Catalan history, you could always visit one of the sites of these many Barcelona sieges: Montjuïc castle, pronounced Mont-JEW-k. And you would be correct if you thought that it was named that because of its initial use as a Jewish burial ground. Fast forward to 1640 and this outcropping overlooking the Mediterranean would be transformed from a lighthouse to a small fort, built up over successive decades into a more formidable fort.
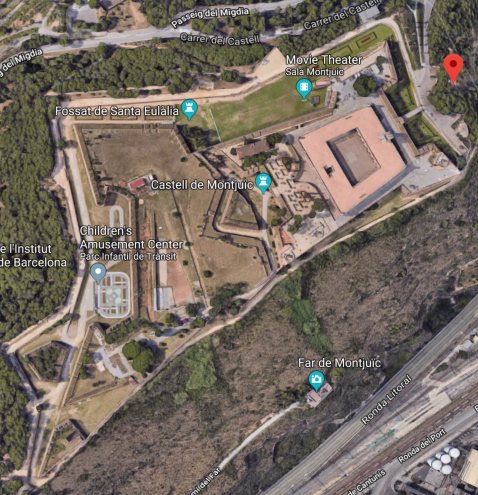
It’s one of the better-maintained fortresses that I’ve been to. As you can see from the Google Maps screenshot below, it’s on a hill and surrounded by a park – access is either via a cable-car and funicular, or a walk through said park.
The Art of War
An aerial view to give you your bearings – the main citadel complex is on the right:
The fortifications themselves were well maintained, with flower beds in the ditch.

So why did they splay the embrasures outward? I thought that would funnel shot *into* the opening?
I’ll let the photos do most of the talking, otherwise you can zoom around the fortress using Google Maps’ Street View, or find any number of descriptions on the various sieges the citadel underwent.

Nope, this guérite doesn’t smell the least bit like urine
And there were moat monsters guarding the ravelin.

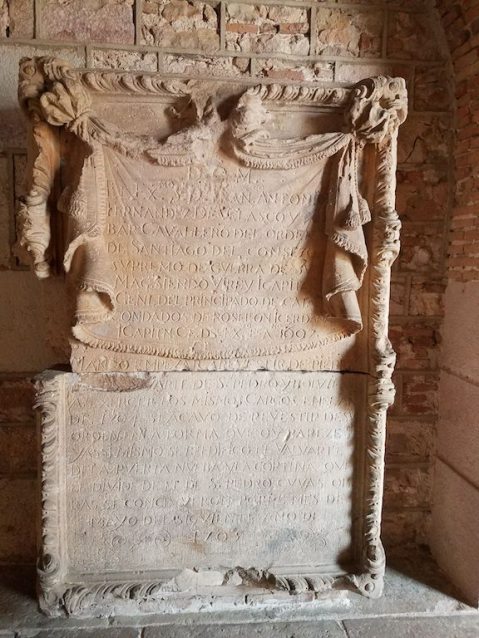
Or, if you seek interactivity, you can figure out what this says, and learn about who was involved in the 1697 and 1705 sieges:
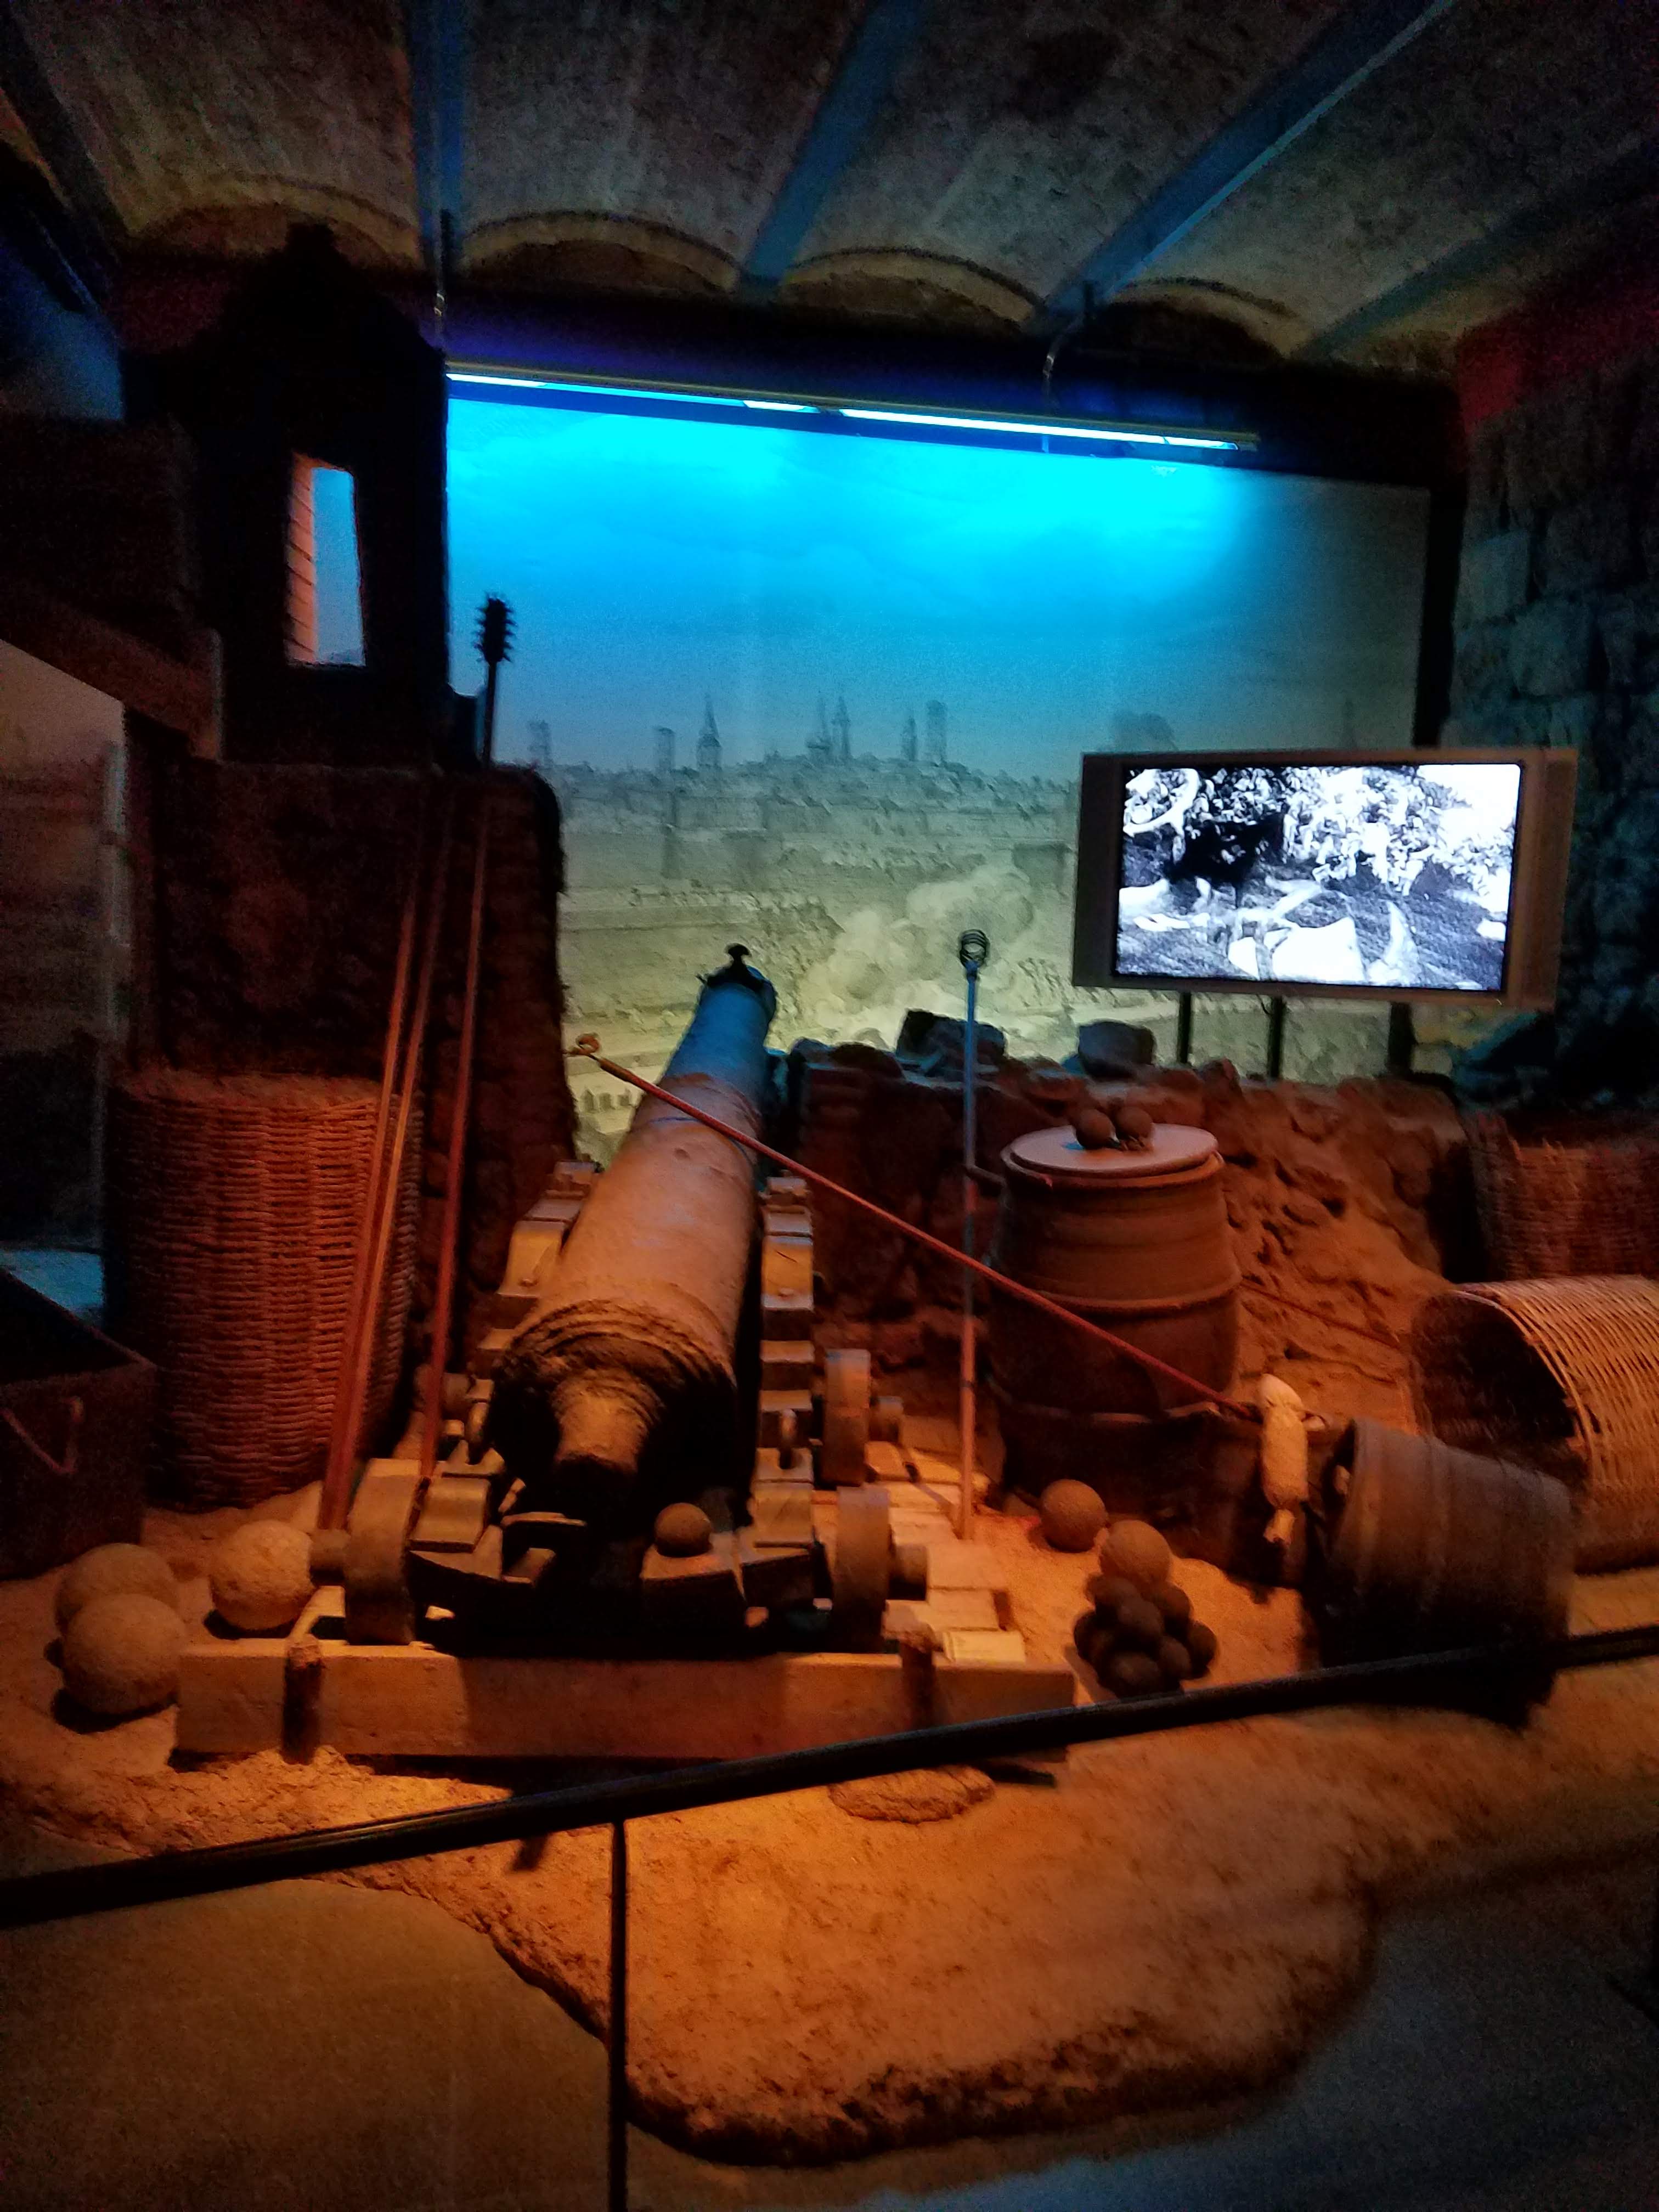
And what does an occupying force do with all this stone overlooking Barcelona? Well, just about any early modern citadel garrison would tell you: use it to intimidate the town into submission. You think it’s a coincidence that the Castilians decided to build a fort there in 1640, when the Reapers’ revolt broke out? So every once in a while over the next few centuries the Spanish military would bombard the restless Barcelonans back into submission. And, starting in the Spanish Civil War, it became the site of a few human rights violations, including the imprisonment, torture and execution of dozens, including political prisoners. With this history, it’s no surprise that the castle’s exhibition on the history of Montjuïc ends with a quotation from the Universal Declaration of Human Rights, article 5 on freedom from torture.
Other random, slightly-less depressing, facts about the citadel:
- Montjuic was one of the locations where measurements were taken to establish the meter in 1792 – there’s a plaque commemorating that.
- It hosted some of the events of the 1992 Barcelona Olympics. And as if on cue, when we were there an archer, possibly a holdover from their Olympics team, was at the butts in the dry ditch.
So definitely worth a visit, especially if you’re with someone who wouldn’t otherwise be caught dead tramping around a fortress. Fortunately for me (but not for my wife), our fortress tramping was just beginning.
But that’s for part 3.
Reminder of SMH 2019
The deadline for panel/paper proposals for the Society for Military History’s annual conference next May is coming up, October 1. We’re in the process of putting together two panels early modern European proposals as I write this, but we’d love to have an early modern take-over of the SMH next year. The conference will be held at my alma mater of Ohio State (Columbus, OH), and the conference theme is “Soldiers and Civilians in the Cauldron of War,” although papers/panels on any germane topic will be considered.
So if you’re interested, get together with some of your friends and propose. If you need help finding co-panelists, you can contact me via the blog, or you can use the SMH’s new Panels Seeking Panelists online forum.

Recent Comments