
Playing around with GIS
More samples of maps I made in a few hours. These are drawn from my War of the Spanish Succession siege dataset, derived from the research appearing in my Vauban under Siege book. In that book I created some maps of the Low Countries theater using Adobe Illustrator – some were decent, others not so much. I’ve posted a few other examples of early modern European military maps here, mostly from the Iberian theater, which I discussed in a Spanish-language article I authored (some examples here).
But now, with QGIS in da house, I can make them a lot quicker. So here are a few examples of my entire WSS siege database mapped, with a few mistakes and a few errors, of course. Ideally, maps like this would’ve been in my dissertation, but that would have meant me graduating in late 2003 instead of late 2002.
The process, for those playing at home: I took my Excel spreadsheet listing 116 sieges (I deleted a few fort sieges because I didn’t want to have to research their lengths and locations), added a column identifying the modern country of each place, converted the spreadsheet into a UTF-8 csv file, then used QGIS’s MMQGIS Geocode plugin to get the lat and long coordinates from Google for each place, placing it as a new layer on top of the Natural Earth base map. I then had to change a few of the coordinates in the QGIS attribute table, mostly because either a) I didn’t specify which Castiglione (or Reggio or Aire) was besieged, or I thought it was Haguenau, Germany, when it was actually Haguenau, France. Fortunately, most of these were pretty obvious from looking at the map, given my knowledge of where the campaigns were conducted. You use the Numerical Vertex Edit plugin to edit coordinates – they cannot be edited in the attribute table. And, fortunately, changing the feature on any level updates it on all other layers.
Then I had to make a new calculated field for the siege length values, because they were imported in as a text string field rather than a decimal numerical field (‘3.8’ instead of 3.8). Once the data was cleaned up, I either used rule-based formatting or graduated symbols to display various attributes about the sieges. Now that I know the procedure, it’ll take just a few minutes to make variations of the map. No more calculating circle diameters in Excel and manually placing them on the map!
First, a map showing 116 siege locations during the war, with black circles indicating those sieges where the besiegers managed to capture the fortress (about 85% overall).

Next, the same map (sans the Layers Panel), but with rule-based symbolism where red circles indicate Allied-conducted sieges, and blue circles indicate sieges undertaken by the Bourbons.

Now, the same basic map, but this time we’re using the numerical siege length field to create graduated point symbols, so we can see the relative length of the sieges. I could, of course, define any min-max diameter for the circles, but if they get too large, you lose the smaller sieges.

Of course, if you just want to be goofy, or simulate what my vision will be like in another ten years, you can make a raster heat map, using the Layer Style-Heatmap option, create your own color ramp from transparent to red, and make a smaller radius. That gives you a map that emphasizes regions which saw many sieges:

Miscellaneous Notes:
I turned on the modern political boundaries, which helps distinguish the Iberian vs. Spanish sieges. Digitized early modern boundaries, and other features, will have to wait until sabbatical.
I haven’t offset those siege symbols for towns that were besieged more than once. Thus, for the first two maps, only one symbol is visible. This is particularly germane for Landau near the Rhine, which saw four sieges, but even the third map doesn’t help much, since three of the sieges lasted between 2.3 and 2.8 months and therefore all three have the same-sized point symbol stacked on top of each other. The heat map, however, emphasizes Landau’s four sieges.
That being said, I did change the render oder (Symbol Levels) on map 1 to have the white circles be drawn on top (Layer Order, white = 1, black = 0). I also put a white outline around each black circle for both maps 1 and 3, so you can see when the circles of several proximate, successful sieges overlap each other (for map 3, Layer Order with smallest/shortest circle drawn on top, with largest circle drawn on the bottom).
Most importantly, I haven’t yet figured out how to combine two attributes into one point symbol (e.g. size of circle as length and besieging side as color of the same circle), but you always need to have goals.
But wait, there’s more! There’s probably some way I could split the Allied and Bourbon into separate layers, make a raster heat map for each of those, and then overlay them.
Just spitballin’ here, but you could also calculate a siege index (maybe number of siege-days) and map that, possibly as a raster heat map. If you run the raster heat map on the siege length layer, you get a rasterized version of map 3:

And, of course, the beauty of GIS is that you can combine this data in any way you’d like, combine it with other data, and focus on subsets of the data. Maybe you want a separate map for each campaign year. Throw in field battles, or the amphibious landings. Add in roads, fortresses, logistical centers, and so on. Maybe you want to spatially analyze these features. The world’s your oyster. Mine too.
Military Strategy For Dummies
Here is a simple operational-level map I created for my European Warfare class to try to reinforce the ideas of:
- What the operational level entails, and looks like on a map, particularly in contrast with a tactical-level map.
- How an army has multiple strategies available to it in order to achieve its strategic objectives. There are others I could have included if I’d had time (esp. amphibious).

Will the reds and blues ever just learn to get along?
Of course as we get further into the 18C and start talking about Napoleon et al, we’ll complicate it with the “operational art”: multiple armies, marching by different routes, etc.
And let’s not forget that whole DIMEFIL thing, courtesy of the DoD.
Feel free to use (because you know you want to), with proper attribution, of course.
Once again, the French take us Anglos to visualization school
I’ve commented before on how impressed I am when I read old French history from the 1970s (e.g. here). I just happened across another example as I tracked down a classic book that I’d seen cited on occasion, but had never actually looked at. And this is what I find on page 144, a map indicating how widely commentary on the 1214 battle of Bouvines spread in various medieval accounts:

From Georges Duby, The Legend of Bouvines, trans. Catherine Tihanyi (Polity Press, 1990), 144.*
This map includes a few different point and area symbols (mostly nominal and ordinal data), and is, to my mind, as interesting for the questions it raises as what ‘argument’ it makes. But that’s what good visualizations should do, encourage us to dive into the details.
And if you really want to know what I think about visualizing historical information, and have an extra hour or two, I pontificated on the subject here.
* Yes, I know, it’s the English 1990 translation and not the 1973 French original. But I don’t have a massive research library at my beck and call, so it’ll do.
What this early modernist learned from the Crusades
Just finished teaching the Crusades for the first time, like, ever. Never even taken a medieval history course for that matter. Sad, no?
Anywho, on my first go-through of a new history course I focus on getting the narrative down. (For those curious, I assigned Madden’s Concise History of the Crusades and Allen and Amt’s source reader.) In later iterations I add in more topical subjects – case studies, interesting primary sources… The first go-round isn’t always the most fun for the students, but if there’s one lesson of History I’ve learned, it’s that you really can’t make any intelligent generalizations about a period, can’t have a discussion of any depth, if you don’t first know what actually happened (or think happened, in the case of the Crusades). Especially if the prof doesn’t know.

Suggestions for corrections/improvements appreciated
So even though I spent extremely little time this semester talking about the period’s warfare (mostly about sacking cities and grand strategic-level stuff), my initial, off-the-cuff and undigested impressions of the military history of the Crusades are:
- Sometimes no organization and no central authority is better than lots of organization and attempted central authority (compare the First and Fourth crusades).
- Sometimes trying to avoid the mistakes made by your predecessors just leads to the same mistake, but by a different route (see just about all the Egyptian campaigns).
- Sometimes trying to avoid the mistakes made by your predecessors leads to massively-impractical schemes (see Maximilian I’s 1518 crusade plan).
- Fighting 2,000 miles from your home base is hard (see every Crusade).
- Fighting 2,000 miles from your home base while relying upon your enemy-from-back-home is even harder (see every Crusade, but especially the Third). Coalition warfare is difficult – William III & Co. did a pretty good job, all told.
- Relatedly, unity is a hard thing to come by (see most Muslim responses to most Crusades, and most Christian responses to most setbacks in the Latin East. And those Normans were a pain in the ass – I’m looking at you Bohemond).
- It is so much easier to teach a subject when you have 4 different historical atlases that illustrate just about every major operation.
- Given my reliance on all those maps, I developed an unoriginal list of generic questions to ask when trying to explain any big shift in foreign policy/war, or why a successful army turns back:
- Did a ruler or general die?
- Were they attacked on another front?
- Did segments of the army(ies) have a falling out?
- Did a coup or civil war break out back home?
- Was there a famine/economic crisis…?
- Some student will inevitably ask about those tiny little arrows on the map, and you’ll have no idea what they refer to. Count on it.
- I’m shocked how important the Byzantine fleet was in controlling early Frankish access to Anatolia via the Bosporus ferry. (But see #1.)
- Avoid naming your kids Baldwin, Raymond, or Alexios.
- I had no idea the Byzantines were so kinky, into maiming each other and all.
- Don’t expect a History Channel special on the Kingdom of Heaven movie to talk about Ridley Scott’s secular caricature of medieval religion. Do expect it to have Kelly DeVries taking us on a tour of a medieval castle.
Future posts on the explosion in French EMEMH research. My advice: learn to read French if you can’t already.
Fall 2015
Busy with many things (thank God for Pocket Informant and GTD), including teaching the Crusades for the first time.
The biggest lesson I’ve learned thus far? If I ever become dictator, my first edict will be to ban the names Raymond and Baldwin. Deus vult!
So some graphical filler while I struggle through the rest of the semester:

Because historians always start their courses long before their courses begin. And no, I won’t tell you how long it took me to make this damn timechart.
Next, a timeline with far too much detail (inevitable in a first draft):

Crusader states, 1144-1192. Note that I’ve started indicating the relationship between a new monarch and the previous one.
I still need to figure out how to visualize causal chains – suggestions, as well as any factual corrections, are welcome.
And on a more general pedagogical note: it’s amazing how much easier (NB: not “easy”) it is to prep for a course in a totally new field if you have four different historical atlases that you can rely upon for detailed maps and chronologies. I only wish EME history had a similar selection.
Bird’s-eye view of the French Wars of Religion
Recently finished up three days on the French Wars of Religion in my Religion, War and Peace course, which means I can now post this old graphic summary of the wars. It almost makes sense of those crazy conflicts. Almost.

Can’t we all just get along?
This is probably my favorite time chart, aesthetically at least, but feel free to provide corrections or comments. Tons of gory detail, but I think you can also see the big picture as well.
Here’s an abbreviated version I put in the margin of my Powerpoint slides:

For the masses
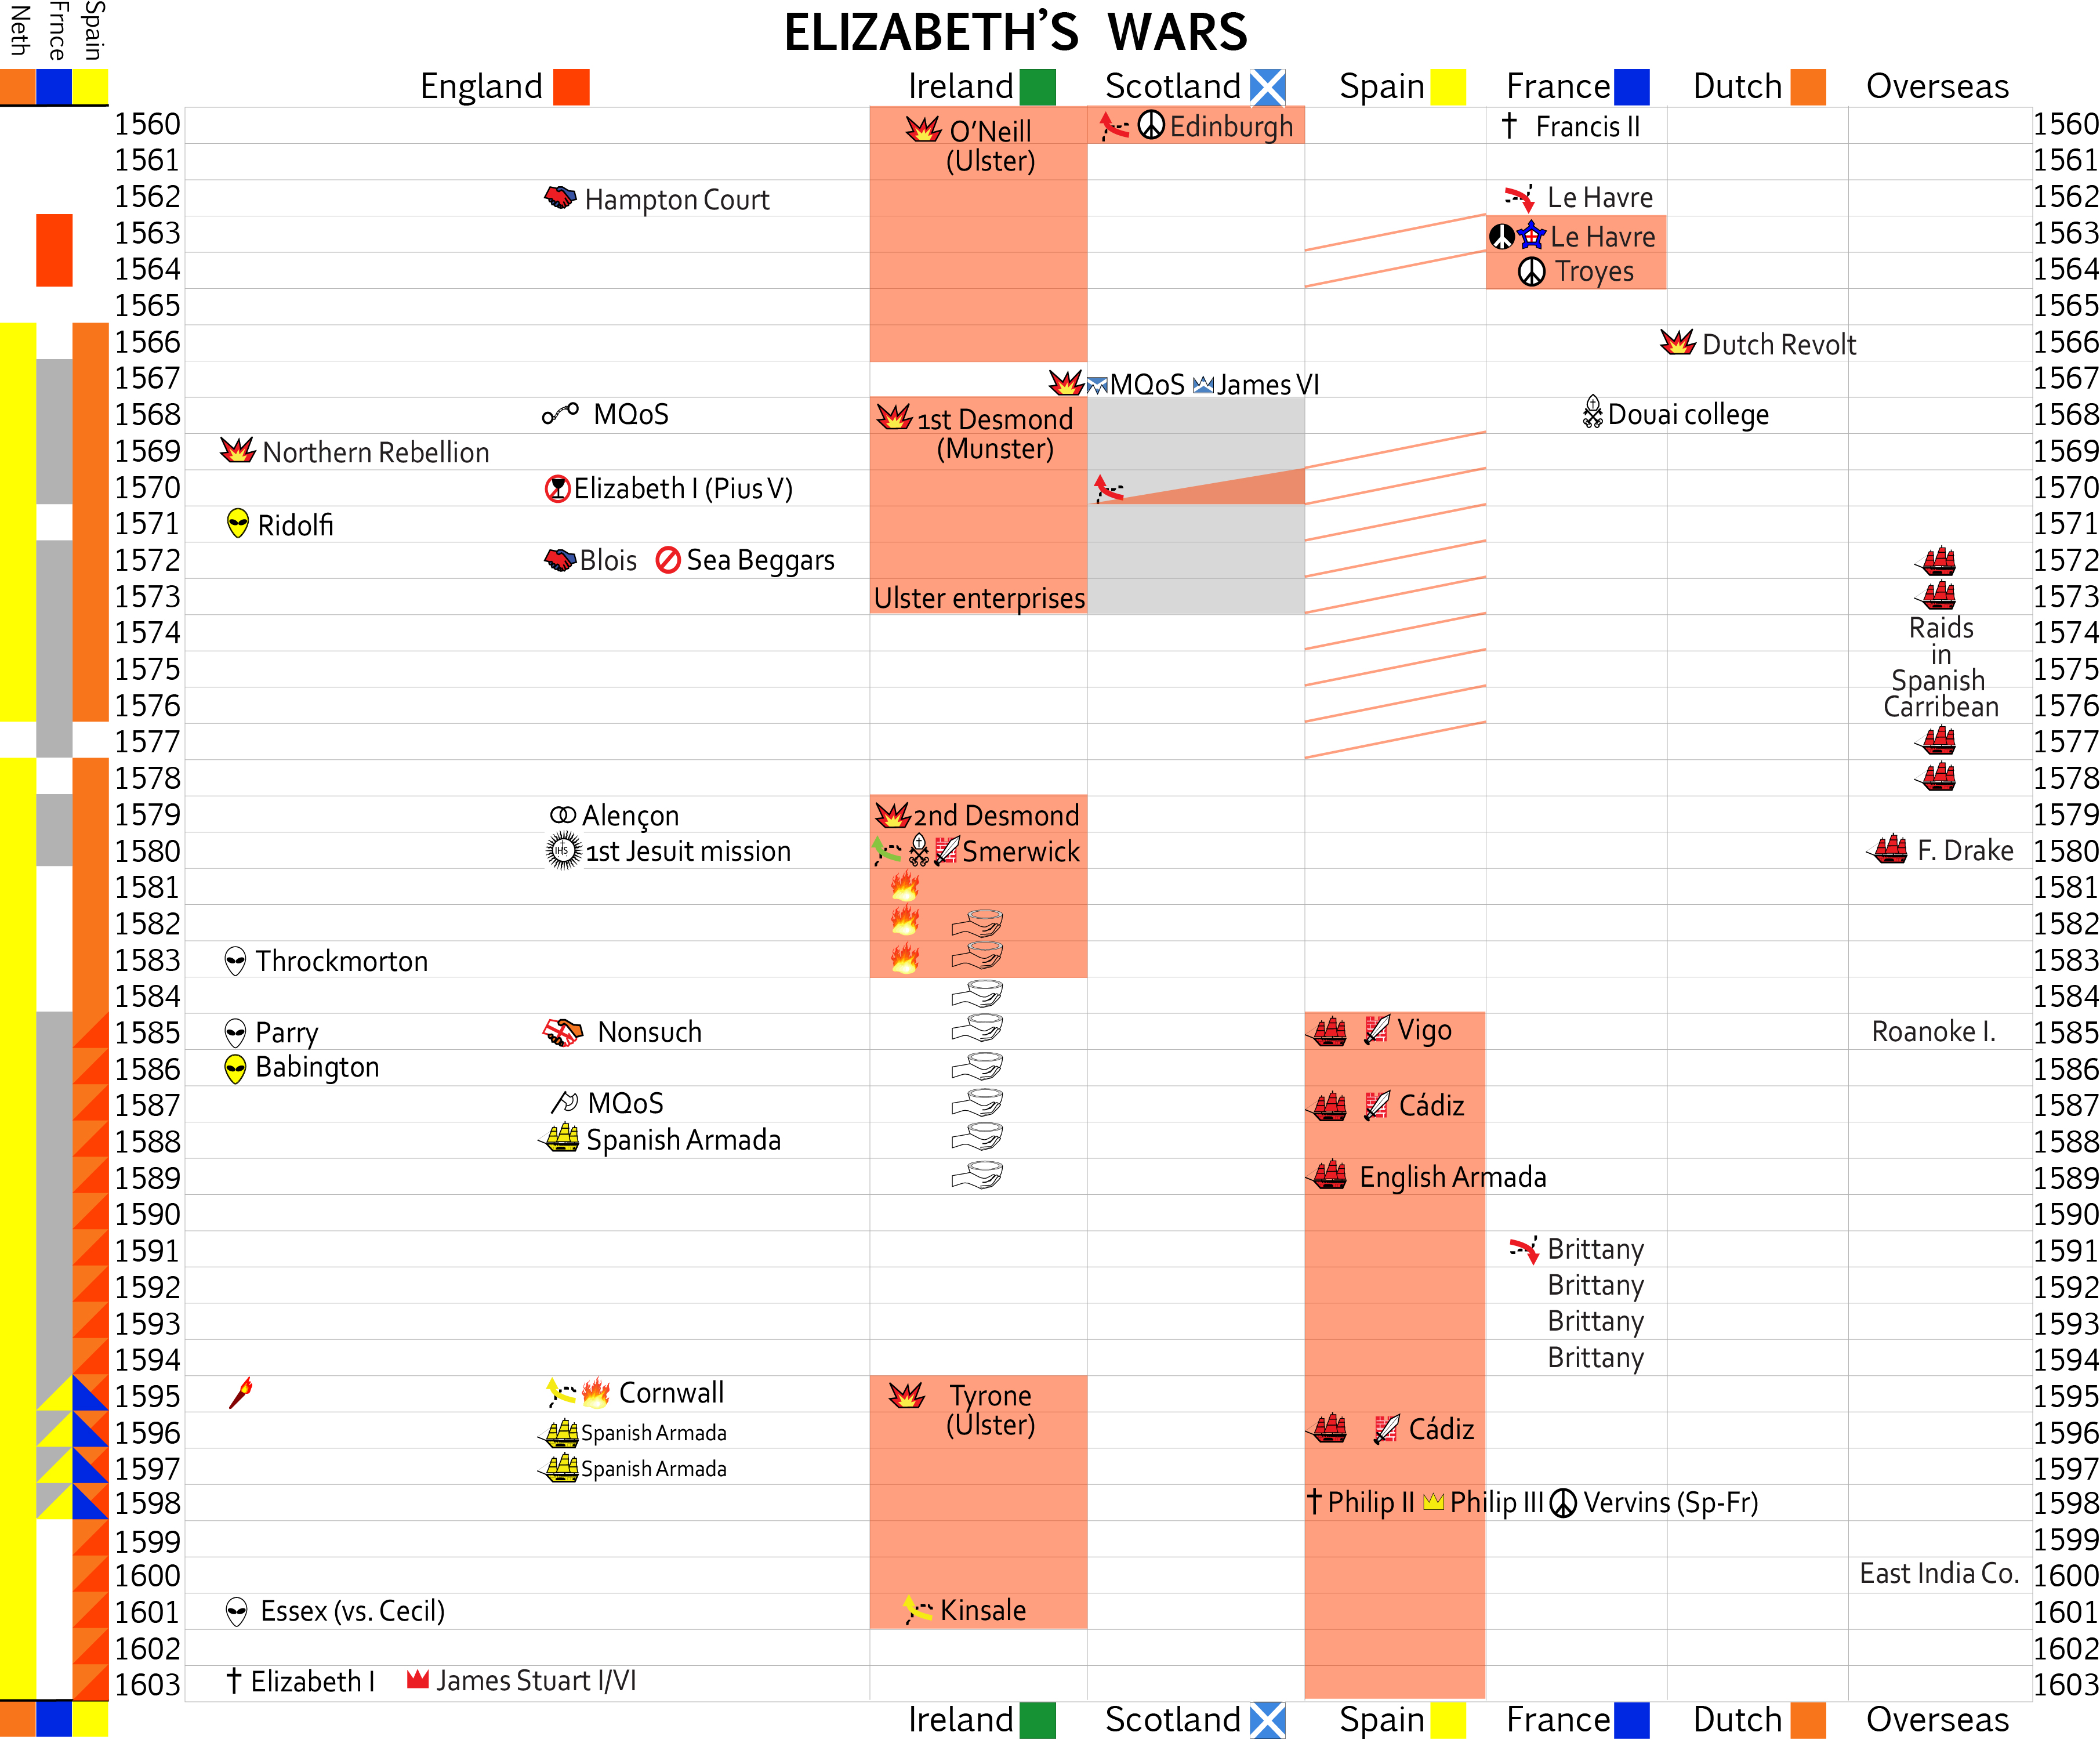
Elizabeth’s wars
Just finished teaching my Elizabeth I section in Tudor/Stuart England. As usual, it’s hard for students to keep straight all the pertinent historical details when reconstructing a narrative – most of the places, people and events are new to them. The same is true for me as well, since almost every course I teach covers at least two centuries (and usually more than one country), which means I teach hundreds of narrative arcs from one year to the next, and frequently have to jump from England to France to Spain to Germany to Italy and beyond. Last time I taught Tudor/Stuart was 6 years ago, with a lot of other periods, topics and countries in between, so it’s been awhile since I delved into the Tudor details.
Preparing for these lectures, then, I rediscovered that historical narrative is, for me at least, one of the hardest ‘types’ of historical knowledge to remember. You can create broad narratives of various thematic topics by, for example, remembering that the ratio of pike to shot gradually declined over the course of the 17C and then rapidly disappeared by the time of the War of the Spanish Succession. There are very few moving parts, if you will, in such stories. And such thematic developments are also relatively simple to explain: maybe it’s about the gradual increase in the rate of fire and the improved accuracy of the weapons, etc. Of course there are far more complications if you start to explore the details, as Bert Hall’s Weapons and Warfare in Renaissance Europe suggests, or if you start comparing specific countries and theaters, or consider the possibility that the “progress” from pike to musket isn’t necessarily linear or inherently moving from less effective to more. But most people, even historians, tend to remain at the much more generalized level. And there usually isn’t that much variation from year to year, or, if there is, we tend to focus and expect linear progression that smooths out the variations over several centuries. In other words, we’re generally interested in the trend line rather than the specific events in the dot plot. Individual cases will be chosen because they are deemed representative of the larger trend.

Red trend line: pattern
Blue dots: specific events
But then we’ve got political and diplomatic and military narratives, which are a bit more complicated because they almost always focus on the specific events themselves, rather than the trend line – a lot more data, and a lot more connections between the points. We can certainly generalize from these narratives to create a thematic argument, e.g. one could argue that Elizabeth’s wars were driven (from the English perspective) by a combination of religious conflict, unstable and potentially hostile neighbors, and economics: Catholic internal and foreign plots + English desire to support the Protestant International + instability and foreign influence in Scotland and Ireland + inviting Spanish overseas trade…. That’s relatively simple, and most early modernists are familiar with such an argument, and it’s an important question to discuss. But we really need to have a handle on the narrative of what actually happened as well. It’s quite another matter to remember the order in which specific events occurred, particularly when there are dozens and dozens of events, each of which was precipitated by other events, and which in turn might precipitate other events.
Admittedly, we could keep it really simple: England fought two wars in the 1550s and 1560s against France but lost their last continental foothold of Calais nonetheless; they also had the occasional intervention against faction-riven Scotland, and from the 1560s on sent support to the French Huguenots and Dutch rebels, becoming directly involved in the war against Catholic Spain (fought in the Netherlands and at sea) from 1585 to the end of Elizabeth’s reign, along with more serious intervention in Ireland during the Tyrone rebellion (the original “Nine Years War”). This might be enough for a very general understanding of the period, though it’s a purely descriptive summary of English military involvement.
Yet as most of us who teach know, most historical textbooks (at all levels) tend to focus on what I’ll call event narratives (suggestions for a typology?). Especially if you’re focusing on English history, or use English-authored works. And that’s where it gets complicated. One option is to focus on particular key individuals. Take one example: the role of Mary Queen of Scots in English foreign policy. So you need to know who she was in the context of Anglo-Scottish-French relations: infant daughter of Scottish King James V (who died, possibly of despair, right after the English crushed his forces at the battle of Solway Moss); an infant princess whom Henry VIII tried to coerce into marriage with his son Edward, aka the Rough Wooing, before she was married off to the French prince Francis, thanks to the connections established by the ‘Auld Alliance’ between France and Scotland; a young Scottish-French princess then Queen consort raised at the French Court under the influence of the ultra-Catholic Guises, widowed in 1560 and returned to Scotland, where “her” kingdom had been ruled by her French mother Mary of Guise, but which was now being Calvinized thanks to John Knox et al (Calvinist missionaries who’d learned their theology in Geneva, and would eventually found the Presbyterian church in Scotland); a queen of Scotland who within 6 years would be forced to abdicate to her infant son James VI (raised by Protestant regents) and flee to England, which made things difficult for her cousin Queen Elizabeth, because various Catholics (English and otherwise) hatched plots to eliminate Elizabeth and thus put the next in line, one Mary Queen of Scots, on the English throne, and hopefully reCatholicize England as a result, an outcome Anglicans had feared ever since their last Queen (Mary) married Philip II of Spain and burned a couple hundred Protestants at the stake. Several plots later (one of which saw the defeated rebels flee to Scotland for refuge, which precipitated another English intervention), Elizabeth finally conceded that Mary’s continued existence served as an inevitable center for intrigue, and she was executed. But of course Elizabeth would die without issue, and the now-grown King James VI of Scotland would end up inheriting the English throne as James I of England, leading to a personal union of the two crowns. Any questions?
And that’s just a simplified version of the Scottish-French angle (admittedly leaving out most of the Scottish and French details) for only the first half of Elizabeth’s reign, with only the most proximate causes mentioned and all the juicy bits about murdered husbands and Virgin Queens left out. We should probably include the Cecils and the Dudleys, and we might as well talk about English relations with Ireland and Spain while we’re at it. Damn that web of history!
Fortunately there have been some very good books published on the subject – I’d recommend Paul Hammer’s Elizabeth’s Wars in particular. Such works made it relatively easy to create a reference timeline to track key events. Assuming you are driven to invest the effort needed to create such timelines, that is. Personally, I came quite late to the utility of timelines, since I was always underwhelmed with the boring two columns found in most books, and, frankly, I tended to think more in sweeping thematic arcs. (Probably the opposite of why many history buffs fall in love with the subject.) Perhaps as a result, one of the big lessons I drew from my graduate school experience was that thematic arguments about the Military Revolution and the like were worth little unless you knew the background narrative. Why such practices and technologies evolved the way they did might even have something to do with when, where and how specific countries fought. Such historical minutiae might, for example, explain why a country might make no “progress” in the military art for 50 years if it was, for example, fighting a particular kind of war (say a civil war) in a particular kind of theater. To mention just one specific example, recent research on early modern fortifications offers very local reasons for the uneven adoption of the trace italienne.
I only began creating linear chronologies when I started teaching full-time, but I’d like to think I’ve caught up and even made one or two improvements to the genre. But you can decide for yourself, if you want to compare the examples I post here (and in previous posts) with the historical timelines in Rosenberg & Grafton’s Cartographies of Time.
So here’s the “simple” version, though it could certainly be made simpler.

Elizabeth’s wars
Here’s the more complicated version. As you can tell, it’s framed from the English perspective (in the large English column, domestic events to the left and foreign-influenced events), with an indication of when England was involved with various wars (the shaded semi-opaque red areas, with each country its own column), but it also tries to give a general sense of the other wars western Europe was engaged in (the narrow columns on the far left).
Elizabeth’s wars in more detail
The above timelines are obviously at the highest, strategic, level. Which means they don’t include any operational details about the wars themselves, other than the occasional mention of a fortress surrendering. That would require a whole separate timechart, or else one in which you drill down or click on links.
My timeline philosophy, then, emphasizes:
- Efficient layout: use as many of Bertin’s variables as possible.
- Consistent iconography: see the blog page on my most frequently used Symbols. I try to use orientation and fill to record additional information. Icon symbols replace words, which means there’s more space and you can quickly skim for shapes (battles, plots, deaths…) rather than having to distinguish event words from all the other words.
- Consistent colors: I use specific colors for each country, and maintain that throughout all the visualizations.
- Consider creating both a detailed and an abbreviated version of the same timeline – particularly useful for teaching if you want to simplify things for the students.
A Never-Ending MapQuest
I find myself at the end of most semesters brainstorming on how I might ease my teaching burden. I teach about eight different upper-level courses on early modern Europe in rotation, on subjects, periods and places ranging from the Renaissance through Napoleon (in addition to Western Civ). Almost every course usually covers 100 years or more, as well as several different European countries. Heck, my Religion, War and Peace course even takes it back to the Old Testament. Since I only teach each course perhaps once every two or three years, I often only vaguely remember the details of many events. Memory really does benefit from repetition, it appears.
So as I reflect on the semester just ending, I wonder for the umpteenth time how I can make it easier to remember a myriad of historical details. I hate the fact that I’ll forget many of the details I covered this semester, and will have to relearn them when I teach the same course again in a couple of years – even rereading my notes requires a lot of time I’d prefer to save for other things. I want, in short, to efficiently prep for class by reviewing a visualization of my notes on the campaign or war or theater or commander or historical event under discussion, and then narrate off of it in class (and provide the visual to students for their own notes). Is that asking too much? Read More…
Bow before the master
Semester teaching winding down, administrative duties ramping up, overdue research projects beckoning. The normal rhythms of academic life, in other words.
I’m working on an ever-expanding post on military historical visualizations (maps, mostly), but in the meantime I’ll post what is, to my eye, the most impressive historical visualization I’ve seen.

Image from Joxe, “La crise cubaine” reproduced in Bertin, Semiology of Graphics, 264.
Why do I like this so much? I can’t really comment on the actual content, not being an expert in the Cuban Missile Crisis. But the design is gorgeous. The diagram does so many things well:
- It deals with data that historians experience all the time: non-quantitative (or perhaps ordinal at best), impressionistic data. Information that is, as I’ve discussed previously, difficult to visualize.
- It gives the viewer a sense of the options available to historical actors, the paths not taken. Historians love them some contingency.
- It suggests the possibility of more than one choice being taken at the same time, of multiple choices being made, and how their effects could potentially contradict each other.
- It helps tell a narrative, a story of how specific decisions were made to increase or decrease the likelihood of outright war, and maybe both at the same time.
- And despite the non-quantitative aspects of the data, the diagram still seeks to categorize the information in a systematic fashion, using visual variables. It shows what we mean when we talk about “escalation”.
- Besides, it uses icons. And you know how much I love icons.
I also find the diagram interesting because it leads to as many questions as answers, making explicit what much textual discussion keeps implicit. The graphic encourages the reader to wonder how the author assigned the level of danger (y-value) of each choice, to wonder how each side sought to reconcile their multiple actions (e.g. how the Soviets both de-escalated and at the same time made broader threats), to consider the extent to which these decision were actually sequential and not concurrent, to wonder where exactly the y-axis reaches a 100% chance of war, and so on. Making such visualizations also forces us, as authors, to explicitly think about these same issues. That’s a good thing.
Why else do I like it? Because I was allured to the general format of multiple spectra awhile ago, though I didn’t implement it nearly as effectively, nor with as much data density, as Joxe:

How Literally Should One Interpret the Bible?
What’s even more impressive about the Cuban missile crisis diagram is that it was created in the 1960s, in a French journal for the mathematical study of political and strategic problems.
So seriously, what has happened to historical visualizations since the 1970s? Why have we regressed to such an extent that most history books barely include a base map of the geography under discussion? (And yet we can peer into the psyche of historical figures by looking at their portraits??) Are our visualization skills that rusty? Are our graphic software skills that rusty? Are Anglophone works that divorced from the French tradition of Braudel et al? At least some semi-recent French works are still trying:

Louis XIV’s Court cabals (Le Roy Ladurie, Saint-Simon and the Court of Louis XIV, 131)
Visualize, man.
The French Revolutionary Wars as you might have seen them
I’m moving into the revolutionary section of my European Warfare, 1337-1815 course, so I thought I’d throw up (not literally) a slightly different type of time chart that I’ve developed. Since entire courses are taught on the few decades from 1789-1815 (including by me), it makes sense to get a bit more granular about those years. Hence a more detailed time chart, month by bloody month.
The events on this first time chart actually have less to do with war and more with political events, but then I can’t lecture about war all the time.

French Revolutionary time chart
But I can lecture about war a lot of the time:

I don’t think I’ve posted an example of this type of (monthly) chart, but then again, I have put up almost 300 posts. As usual, there are plenty of opportunities for improvements, but that would take time.

Recent Comments